This is clearly a very serious issue, and so I will go into it in more detail in this post. I will do this by focusing on the grape-growing and wine-making parts of the so-called Production Life Cycle (PLC), rather than either the retail or end-of-life PLC phases.
Conveniently, the Australian Wine Research Institute (AWRI) has recently published a Life Cycle Assessment (LCA) as applied to Australian wine production (Understanding the greenhouse gas emissions of Australian wine production). * This study calculated the greenhouse gas outputs associated with the production and distribution of Australian bottled and cask wine. This is an excellent source of information, which can also be applied to the wine industry globally.
As noted in the report:
Life Cycle Assessment (LCA) is a method for assessing the environmental impact and performance of a process or product in terms of its greenhouse gas emissions or carbon footprint. LCAs are generally either ‘cradle to grave’ — considering all impacts from extraction and processing of raw materials, energy production, use, recycling and disposal — or ‘cradle to gate’ — considering all impacts only until the product leaves the producer.The LCA process actually requires complex mathematical modeling, in order to produce estimates for a typical (“average”) example of the product concerned. In this case, the initial data, as used for the modeling, were collected from 38% of Australia’s total vineyard area, plus wineries covering 43% of the total Australian production. Various features of the grape-growing and wine-making processes were then estimated from these comprehensive data.
The report concludes that the average ‘cradle to grave’ carbon footprint of Australian wine in 2022 was calculated to be 1.05 kg CO2 equivalent per L. However, most importantly, this varies dramatically depending on the type of packaging used. This is shown for four possible packaging types in this first graph. As you can see, bottles do not fare well, compared to bag-in-box distribution (called a “cask“ in Australia, which is the word used in the following graphs).
This becomes even more important if we add in the carbon expense of exporting the wine. The next figure shows that the carbon emissions of bottles delivered domestically is pretty much the same as the carbon emissions of exporting wine in bulk, because the packaging costs (glass) balance the transport costs (ships). Exporting wine in bottles is therefore the worst-case scenario. So, for the wine industry the big issue is, indeed, packaging, not either grape-growing or wine-making.
Next, the report compares the carbon emissions associated with Australian viticulture as compared to Australian wineries. The immediately preceding graph shows that grape-growing and wine-making have very similar carbon footprints to each other (ie. it is packaging and transport that has the biggest effect). Indeed, an earlier study from the AWRI concluded that grape-growing contributes 15% to the CO2 in a bottle of wine and wine-making contributes 17% (Understanding carbon emissions in the wine industry). This rough equality must be a social relief to both the grape-growers and the wine-makers.
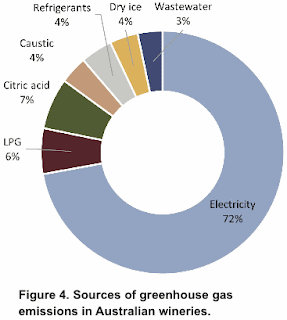
However, the origins of their carbon emissions are very different between the two parts of the Life Cycle. As shown in the graphs below, both electricity and diesel fuel make up 70% of the carbon load for grape-growers, whereas electricity alone makes up 70% for wine-makers. Clearly, electric tractors, for example, might go a long way towards helping grape-growers (Electric tractors are rolling out in the field).
Anyway, I recommend that you take a look at the original report for yourselves, even if you don’t live in Australia. The situation is probably not very different compared to where you do live. Furthermore, the report estimates are interestingly compared for 2022 versus 2016 (with a nice improvement through time!). The second report that I mentioned above also has an interesting discussion of collecting the CO2 released during fermentation, and then re-using it for other purposes, which would be a positive contribution by the wine industry towards reducing atmospheric CO2.
There is a further discussion of issues in this article: The carbon economy and vineyards — what’s the status quo? After all, the future will involve reducing carbon emissions, so we might as well start now, as discussed here: Decarbonising wine: sector strategy to tackle emissions.
* Published in the Wine & Viticulture Journal Issue 2, 2023 pp. 34-37. The illustrations in this post are taken from that publication.


No comments:
Post a Comment