I have already blogged about Fifty years of Bordeaux vintages, based on the Wine Cellar Insider Bordeaux Vintage Ratings from 1959 to 2014. In this post I expand the time-frame to 200 years for the same wine-producing region.
These long-term data on the Bordeaux red-wine vintages comes from Tastet & Lawton, the oldest surviving courtier firm in Bordeaux.
Tastet & Lawton (Courtiers Assermentés) was established in 1740 by Abraham Lawton, an Irish immigrant. In the Bordeaux wine trade, the courtiers (brokers) act as intermediaries between the chateaux (wine producers) and the négociants (wine merchants) (see En primeur, negociants, courtiers, the Bordeaux wine system explained). There are c. 100 significant chateaux and c. 300 négociants, along with c. 90 courtiers.
There are two versions of the Tastet & Lawton vintage chart available online, one in French and one in English. I have put my own English-language version online because there are a number of inconsistencies in the originals, which I have tried to correct.
The Tastet & Lawton Bordeaux Vintage Reports, 1795 to 2005
Although vintage assessments are available from the 1795 vintage up to and including 2005, the recording of harvest quality did not start until 1900. The quality is scored on an increasing scale:
Mauvaise (Poor), Médiocre (Mediocre), Moyenne (Average), Assez bonne (Rather good), Bonne (Good), Très bonne (Very good), Exceptionnelle (Exceptional)
The harvest volume is not recorded using any consistent wording through time, with at least 20 different expressions being used. General comments on the vintage are provided in all cases.
| Year | Harvest start |
Harvest volume | Harvest quality |
Comments |
| 1795 | 24-sept. | Not very abundant | Very good year. | |
| 1796 | 30-sept. | Not very abundant | Mediocre year, thin wines. | |
| 1797 | 02-oct. | Not very abundant | Mediocre year, thin wines. | |
| 1798 | 13-sept. | Passably abundant | Marvelous vintage, still spoken of 20 years later; full, robust silky wines. | |
| 1799 | 05-oct. | Not very abundant | Poor year. | |
| 1800 | 23-sept. | Not very abundant | Poor year. | |
| 1801 | 14-sept. | Not very abundant | Poor year. | |
| 1802 | 23-sept. | Average harvest | Marvelous year, almost rivals 1798. | |
| 1803 | 25-sept. | Average harvest | Less than 1802, nonetheless good. | |
| 1804 | 15-sept. | Average harvest | Mediocre year. | |
| 1805 | 23-sept. | Abundant harvest | Mediocre year. | |
| 1806 | 20-sept. | Ordinary harvest | Poor year. | |
| 1807 | 11-sept. | Small harvest | Good year. | |
| 1808 | 13-sept. | Ordinary harvest | Good year, ordinary wines. | |
| 1809 | 06-oct. | Small harvest | Very poor year. | |
| 1810 | 19-sept. | Ordinary harvest | Passable year. | |
| 1811 | 14-sept. | Rather abundant | The most remarkable wines; known as “The Year of the Comet”. | |
| 1812 | 21-sept. | Very ordinary harvest | Weak, insignificant year. | |
| 1813 | 04-oct. | Ordinary harvest | Mediocre year, lacking character. | |
| 1814 | 29-sept. | Ordinary harvest | Very good. | |
| 1815 | 25-sept. | Very little wine | Marvelous, on a par with the 1798 and 1811. | |
| 1816 | 27-oct. | 1/4 volume of an abundant year | Detestable year. | |
| 1817 | 03-oct. | 1/5 normal harvest | Very ordinary year. | |
| 1818 | 17-sept. | Half-harvest | Rather good year, although a tad hard and of little reputation. | |
| 1819 | 20-sept. | Ordinary harvest | Perfect, admirable year. | |
| 1820 | 30-sept. | Good half-harvest | Year lacking character, without color. | |
| 1821 | 04-oct. | Smaller harvest than 1819 | Insignificant, mediocre year. | |
| 1822 | 27-aug. | Very ordinary harvest | Rather dry but good, robust wines. | |
| 1823 | 07-oct. | Very ordinary harvest | Without color, value or reputation the first year; later a very elegant wine with a well-deserved success. | |
| 1824 | 04-oct. | Very little wine | Disappointing year. | |
| 1825 | 11-sept. | Ordinary harvest | Very robust wines which became quite admirable, but which took a very long time to develop. | |
| 1826 | 20-sept. | Rather abundant | Very mediocre. | |
| 1827 | 20-sept. | Abundant harvest | Without reputation at first, but ending up admirably well. | |
| 1828 | 15-sept. | Ordinary harvest | Marvelous year for wines with elegance, grace, fragrance, delicious taste. | |
| 1829 | 26-sept. | Ordinary harvest | Detestable year. | |
| 1830 | 16-sept. | Very minimal harvest | Mediocre year. | |
| 1831 | 14-sept. | Very minimal harvest | Excellent year, very mellow<./td> | |
| 1832 | 22-sept. | Very minimal harvest | Ordinary year, without charm. | |
| 1833 | 21-sept. | Abundant harvest | Ordinary year. | |
| 1834 | 09-sept. | Very minimal harvest | Excellent year. | |
| 1835 | 23-sept. | Abundant harvest | Light, elegant wines (average quality). | |
| 1836 | 24-sept. | Minimal harvest | Very poor year. | |
| 1837 | 25-sept. | Abundant harvest | Ordinary year. | |
| 1838 | 29-sept. | Very minimal harvest | Very mediocre year. | |
| 1839 | 26-sept. | Average harvest | Ordinary year<./td> | |
| 1840 | 17-sept. | Abundant harvest | Good year. | |
| 1841 | 18-sept. | Very abundant | Excellent year. | |
| 1842 | 20-sept. | Minimal harvest | Ordinary year. | |
| 1843 | 06-oct. | Very minimal harvest | Very poor year. | |
| 1844 | 15-sept. | Abundant harvest | Ordinary year. | |
| 1845 | 10-oct. | Very minimal harvest | Very poor year. | |
| 1846 | 14-sept. | Rather abundant | Good, robust wines. | |
| 1847 | 27-sept. | Very abundant | Exquisite wines, not very robust. | |
| 1848 | 20-sept. | Very abundant | Exquisite, robust wines. | |
| 1849 | 22-sept. | Average harvest | Ordinary year. | |
| 1850 | 29-sept. | Abundant harvest | Very light, ordinary wines. | |
| 1851 | 27-sept. | Average harvest | Good, robust wines. | |
| 1852 | 24-sept. | Average harvest | Very light wines, rather good. | |
| 1853 | 09-oct. | Very minimal harvest | Very poor year. | |
| 1854 | 06-oct. | Not very abundant harvest due to powdery mildew | Very mediocre wines, considered good at first and sold at a high price. | |
| 1855 | 07-oct. | Not very abundant harvest due to powdery mildew | Very mediocre wines, considered good at first and sold at a high price. | |
| 1856 | 01-oct. | Not very abundant harvest due to powdery mildew | Very ordinary wines showing a taste of powdery mildew. | |
| 1860 | 26-sept. | Abundant harvest | Very light, very bad wines. | |
| 1861 | 22-sept. | Very small harvest due to major frost on May 6th | Good wines, elegant and very expensive. | |
| 1862 | 20-sept. | Rather abundant | Average quality. | |
| 1863 | 23-sept. | Not very abundant | Adequate quality but lacking maturity. | |
| 1864 | 17-sept. | Very abundant | Exquisite, extremely mellow, ripe, fragrant and rich (balanced wines). | |
| 1865 | 06-sept. | Very abundant | Wines good and ripe, but hard; took a long time to come together. | |
| 1866 | 21-sept. | Average harvest | Very poor. | |
| 1867 | 18-sept. | Rather abundant | Ordinary. | |
| 1868 | 07-sept. | Rather abundant | Coarse wines, hard, lacking charm, too expensive. | |
| 1869 | 15-sept. | Very abundant | Remarkable and complete wines. | |
| 1870 | 10-sept. | Rather abundant | Wines very good, very ripe, and very full-bodied. | |
| 1871 | 18-sept. | Rather abundant | Wines light but very elegant. | |
| 1872 | 22-sept. | Not very abundant | Ordinary year. | |
| 1873 | 20-sept. | Not very abundant | Ordinary year; terrible frost April 28th. | |
| 1874 | 14-sept. | Very abundant | Very good wines. | |
| 1875 | 24-sept. | Very abundant | Wines very good and elegant. | |
| 1876 | 26-sept. | Not very abundant | Very ordinary year. | |
| 1877 | 20-sept. | Rather abundant | Light year but charming wines. | |
| 1878 | 19-sept. | Rather abundant | Very good year. | |
| 1879 | 09-oct. | Not very abundant | Ordinary year<../td> | |
| 1880 | 21-sept. | Not very abundant | Ordinary year. | |
| 1881 | 12-sept. | Not very abundant | Wines solid, but without charm. | |
| 1882 | 28-sept. | Average harvest | Very light wines, rather elegant; touched by mildew. | |
| 1883 | 27-sept. | Average harvest | Light wines, very ordinary quality. | |
| 1884 | 25-sept. | 2/3 normal harvest | Mediocre wines; mildew. | |
| 1885 | 29-sept. | 1/2 normal harvest | Very ordinary quality, wines touched by mildew. | |
| 1886 | 25-sept. | 2/3 normal harvest | Ordinary quality, wines deeply affected by mildew. | |
| 1887 | 19-sept. | 1/2 normal harvest | Full-bodied, healthy wines thanks to treatment against mildew. | |
| 1888 | 02-oct. | Abundant harvest | Good year, elegant wines. | |
| 1889 | 29-sept. | Abundant harvest | Decent year, rather elegant wines. | |
| 1890 | 29-sept. | Average harvest | Full-bodied, deeply-colored wines; rather good. | |
| 1891 | 02-oct. | Average harvest | Mediocre and green wines. | |
| 1892 | 22-sept. | 1/2 normal harvest | A blast of hot air August 15th—45°C, wines burnt and lacking color; elegant. | |
| 1893 | 15-aug. | Exceptionally abundant | Wines thought to be excellent became major disappointments. | |
| 1894 | 05-oct. | 1/2 normal harvest | Wines of little quality, green and meager. | |
| 1895 | 22-sept. | Average harvest | A year of great heat. Many wines spoiled by acidity. The wines which were spared were remarkable. | |
| 1896 | 20-sept. | Very abundant | Fine and delicate wines. | |
| 1897 | 20-sept. | 1/2 normal harvest | Very mediocre wines. | |
| 1898 | 23-sept. | 1/2 normal harvest | Wines that were a little hard but came to be appreciated later. | |
| 1899 | 24-sept. | Abundant harvest | Year of very great quality. | |
| 1900 | 24-sept. | Very abundant | Exceptional | Great vintage of the century. |
| 1901 | 19-sept. | Very abundant | Mediocre | Thin wines which sold for practically nothing. Certain wines turned out to be very pleasant. |
| 1902 | 11-sept. | Abundant | Poor | Wines without character. Forget them. |
| 1903 | 23-sept. | Abundant | Poor | Insignificant year. |
| 1904 | 21-sept. | Abundant | Good | Wines which disappointed with age. |
| 1905 | 14-sept. | Abundant | Average | Light but very elegant wines. |
| 1906 | 18-sept. | 1/2 normal harvest | Good | Wines with exceptionally full body. |
| 1907 | 10-sept. | Abundant | Average | Light, elegant, resembling the 1905s. |
| 1908 | 23-sept. | Average | Mediocre | Wines a little hard, lacking charm. |
| 1909 | 17-sept. | Average | Mediocre | Disappointing wines. Believed to be good at first. |
| 1910 | 23-sept. | 1/4 normal harvest | Poor | Very mediocre vintage. |
| 1911 | 04-oct. | Average | Rather good | A very hot year. |
| 1912 | 18-sept. | Abundant | Poor | Wines lacking a lot of structure. |
| 1913 | 23-sept. | Abundant | Poor | Flat wines. |
| 1914 | 24-sept. | Average | Mediocre | Wines which were believed to be very good turned out to be great disappointments. |
| 1915 | 17-sept. | 1/2 normal harvest | Poor | A year to forget. |
| 1916 | 20-sept. | Average | Good | Solid and full-bodied wines, lacking a bit of charm. |
| 1917 | 22-sept. | Average | Mediocre | Light and fragrant wines. |
| 1918 | 17-sept. | Average | Average | Wines healthy but harsh. |
| 1919 | 20-sept. | Abundant | Average | Light wines without great quality. |
| 1920 | 20-sept. | Average | Good | Still several fine bottles. |
| 1921 | 17-sept. | Average | Very good | Extremely hot year, difficult to age wines. Still several great bottles. |
| 1922 | 11-sept. | Very abundant | Mediocre | Wines light and flat. |
| 1923 | 11-sept. | Average | Average | Wines with little color, somewhat burnt. |
| 1924 | 27-sept. | Abundant | Very good | Certain wines are still exceptional. |
| 1925 | 16-sept. | Abundant | Mediocre | Green wines lacking maturity. |
| 1926 | 28-sept. | 1/2 normal harvest | Very good | Certain wines are still exceptional. Much coulure. |
| 1927 | 27-sept. | Average | Poor | Very little vintage. |
| 1928 | 23-sept. | Average | Exceptional | Remarkable wines; some a little hard. |
| 1929 | 18-sept. | Average | Exceptional | Great vintage of the century. |
| 1930 | 19-sept. | 1/2 normal harvest | Poor | A vintage to forget. |
| 1931 | 30-sept. | Average | Mediocre | Year close to the preceding vintage. |
| 1932 | 20-sept. | 1/2 normal harvest | Poor | Comparable to 1930. |
| 1933 | 10-oct. | Average | Average | Light and fragrant wines. |
| 1934 | 21-sept. | Abondant | Very good | Several great bottles that are still pleasant to drink. |
| 1935 | 10-sept. | Abundant | Mediocre | Green wines lacking maturity. |
| 1936 | 25-sept. | Average | Mediocre | Green wines lacking maturity. |
| 1937 | 26-sept. | Average | Very good | Still many great wines. |
| 1938 | 13-sept. | Average | Average | In decline. “Useful” wines without great quality. |
| 1939 | 21-sept. | Very abundant | Average | In decline. Light and fragrant wines. |
| 1940 | 24-sept. | Average | Rather good | Rather light wines. |
| 1941 | 20-sept. | Average | Poor | No successes. |
| 1942 | 30-sept. | Average | Average | With the 1943s, the best year of this period. |
| 1943 | 14-sept. | Average | Very good | Several great successes. |
| 1944 | 09-sept. | Average | Average | Little year. |
| 1945 | 21-sept. | 1/2 normal harvest | Exceptional | Disastrous frost on May 2nd. Very concentrated wines, many still surprisingly young. |
| 1946 | 07-sept. | Average | Average | In decline. Green wines, lacking maturity. |
| 1947 | 25-sept. | Average | Very good | Several legendary bottles which approach perfection. Wines full of charm. |
| 1948 | 15-sept. | Average | Good | Several exceptional wines. |
| 1949 | 22-sept. | Average | Very good | Magnificent wines: can still continue to age. Similar to 1947. |
| 1950 | 22-sept. | Abundant | Good | Light, pleasant wines. Several great wines. |
| 1951 | 18-sept. | Average | Mediocre | Very average wines. |
| 1952 | 02-oct. | Average | Very good | Firm, tannic, long-aging: some great bottles. |
| 1953 | 11-sept. | Average | Very good | Great classic year: balance, richness, finesse, long-lasting. |
| 1954 | 22-sept. | Average | Mediocre | In decline. Clean, healthy wines but lacking in maturity. |
| 1955 | 14-sept. | Average | Very good | Firm, concentrated, long to open up. Several very great bottles. |
| 1956 | 07-oct. | 1/4 normal harvest | Mediocre | Catastrophic frost in February; little or no production. |
| 1957 | 30-sept. | Not abundant | Average | Alarming degree of coulure. With few exceptions, wines in decline. |
| 1958 | 06-oct. | 1/2 normal harvest | Average | Little vintage. |
| 1959 | 20-sept. | 1/2 normal harvest | Exceptional | Hot and dry year. Difficult vinifications. Very great wines, still improving with age. |
| 1960 | 15-sept. | Average | Average | Rather average vintage, on the decline. |
| 1961 | 17-sept. | Very little | Exceptional | Great vintage of the century. |
| 1962 | 01-oct. | Abundant | Very good | Pleasant, charming wines to taste; reminiscent of the 1924s. |
| 1963 | 01-oct. | Abundant | Mediocre | Very average year. |
| 1964 | 21-sept. | Abundant | Very good | Uneven quality; several great wines for long aging. |
| 1965 | 30-sept. | Abundant | Mediocre | Disappointing year. |
| 1966 | 20-sept. | Average | Very good | Classic vintage of great elegance. The decade’s best, after 1961. |
| 1967 | 25-sept. | Average | Rather good | Average vintage in the Médoc. |
| 1968 | 22-sept. | Average | Mediocre | On the decline compared to the previous vintage. |
| 1969 | 23-sept. | Little | Average | Average year. |
| 1970 | 24-sept. | Very abundant | Very good | Tannic and rather hard wines. The best will age into the next century. |
| 1971 | 27-sept. | Little | Very good | Wines that are elegant and a little tender, the finest are at their best. |
| 1972 | 09-oct. | Average | Average | Often average wines. |
| 1973 | 20-sept. | Very abundant | Average | In decline; very few successes. |
| 1974 | 24-sept. | Abundant | Average | Disappointing year. |
| 1975 | 22-sept. | Average | Very good | Tannic wines of uneven quality. Some great successes. |
| 1976 | 13-sept. | Abundant | Good | Quickly evolving. |
| 1977 | 04-oct. | Little | Average | Frost on March 31st and April 9th. Hard wines without a future. |
| 1978 | 05-oct. | Average | Very good | Classic wines, elegant, at their best. |
| 1979 | 01-oct. | Very abundant | Good | The best wines are harmonious and balanced. |
| 1980 | 10-oct. | Average | Rather good | Supple and fruity. Most are on the decline. |
| 1981 | 28-sept. | Average | Good | Wines at their maturity. |
| 1982 | 13-sept. | Very abundant | Exceptional | Magnificent wines, long-lasting, through to the middle of the next century. |
| 1983 | 26-sept. | Abundant | Very good | Fully expressive wines. |
| 1984 | 01-oct. | Average | Average | Year of often disappointing wines. |
| 1985 | 25-sept. | Abundant | Very good | Already remarkable wines. |
| 1986 | 26-sept. | Very abundant | Very good | Very great year for long-aging wines in the Médoc. |
| 1987 | 01-oct. | Average | Rather good | Supple wines, fruity and elegant; satisfying to drink while young. |
| 1988 | 28-sept. | Very abundant | Very good | Classic wines which need to age. |
| 1989 | 03-sept. | Abundant | Exceptional | Very great year for long-aging wines. |
| 1990 | 10-sept. | Very abundant | Exceptional | Great, hot year. Wines with great aging potential. |
| 1991 | 27-sept. | Very little | Rather good | Frost on April 21st. Red wines at their plateau. |
| 1992 | 24-sept. | Very abundant | Average | Red wines at their plateau. |
| 1993 | 20-sept. | Very abundant | Rather good | Rather rapidly evolving red wines. Very good. |
| 1994 | 13-sept. | Abundant | Good | Classic red wines. |
| 1995 | 13-sept. | Abundant | Very good | Homogeneous year. Great red wines, supple and harmonious. |
| 1996 | 18-sept. | Abundant | Very good | Great year for long-aging wines in the Médoc. |
| 1997 | 07-sept. | Abundant | Good | Fruity, supple, charming wines. |
| 1998 | 23-sept. | Abundant | Very good | Very successful wines, endowed with good potential. |
| 1999 | 30-aug. | Abundant | Good | Very harmonious vintage which can age well. |
| 2000 | 18-sept. | Abundant | Exceptional | Greatest vintage of the century, similar to the 1900! |
| 2001 | 25-sept. | Abundant | Very good | Better structured than 1999. Elegant vintage. |
| 2002 | 24-sept. | Average | Good | Cabernet very successful. Powerful and structured. |
| 2003 | 02-sept. | Average | Very good | Heat wave in summer. Much potential to be a great vintage. |
| 2004 | 16-sept. | Abundant | Very good | Close to 2002, more fruity, more dense. |
| 2005 | 18-sept. | Average | Exceptional | Historically great vintage. Generally successful. |
Analysis of the data
The harvest quality has also been given a rating score (scale: 0-20) by Tastet & Lawton, based on the following equivalence with the words above:
| 19-20 | Exceptional |
| 17-18 | Very good |
| 15-16 | Good |
| 13-14 | Rather good |
| 10-12 | Average |
| 3-9 | Mediocre |
| 0-2 | Poor |
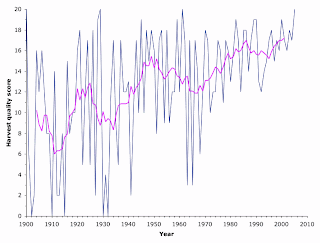
These scores are shown as a time series in the first graph. The blue line connects the data points, whereas the pink line is a running average (it shows the average value across groups of 9 consecutive years, thus smoothing out the long-term trends).
Clearly, through time there has been a general increase in score, along with a decrease in between-year variation. That is, vintage quality has both improved and become more consistent. This matches the trend discussed in the post on Fifty years of Bordeaux vintages, and extends it back a further 50 years. Being a Bordeaux vigneron has been a more reliable profession than it was before then.
The worst years for Bordeaux red wines were during the periods 1910-1915 and 1930-1935, while the best years were 1920-1925, 1945-1950, and the time since 1980. Indeed, there has been no vintage score below 10 since 1970.
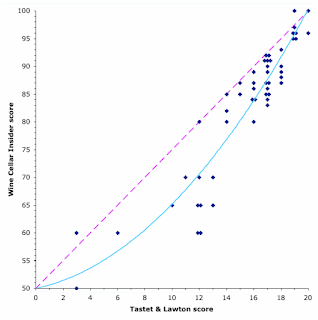
On a technical matter, we can compare the Tastet & Lawton vintage-scoring system with that of the Wine Cellar Insider (produced by Jeff Leve). This is done in the second graph, where each point represents a vintage scored by both systems.
If the two scoring systems are identical then the points should lie on or near the pink line. However, the Tastet & Lawton score is almost always greater than that of the Wine Cellar Insider (so that the points lie below and to the right of the line). This means that a curved relationship fits better than a linear one, as shown by the blue line (the coefficient of variation = 0.87 for this line, which indicates a good fit between the line and the points). This line indicates that Tastet & Lawton have given higher scores for the poorer vintages compared to the Wine Cellar Inside, but they have been in closer agreement for the better vintages. Perhaps this is related to the fact that the Wine Cellar Insider scores were give retrospectively whereas the Tastet & Lawton scores were produced at the time of the vintage
The Tastet & Lawton data also include the official start date for each vintage. Regarding harvest dates, V. Daux et al. (2012. An open-database of grape harvest dates for climate research: data description and quality assessment. Climate of the Past 8: 1403-1418) note:
Prior to the French revolution, in most areas, wine owners were not free to harvest at their convenience. They had to wait for a public order to harvest (“ban des vendanges”) ... After the revolution, vine-growers were theoretically free to begin the harvest when they wanted to. In practice, most parishes maintained a compulsory minimum date for grape harvest in order to preserve law and order. After 1791, the date was set by the mayor, on vine growers’ advice. When several varieties were grown in the same area, the official date corresponded to the earliest and/or to the most important variety. The law of 9 July 1889 entitled the municipalities to keep or give up the “ban des vendanges” practice, which led to its disappearance in almost all France ... In France, since 1979, the harvest date has been determined by the Prefect’s service on a proposal of the National Institute of Origin and Quality, after the notice of the agency defined for each vineyard, taking into account the planting and the status of vineyards.
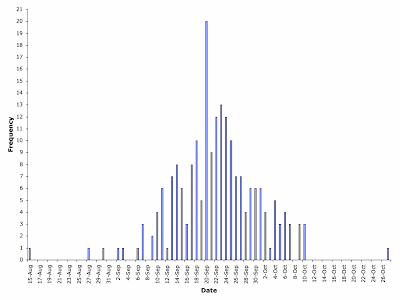
The harvest-date information is plotted in the third graph, which shows a count of how many vintages started on each date. These data cover the full 210 years (1795-2005), unlike the vintage scores.
Mostly, vintage has started in the last 2 weeks of September. However, two outlying vintages are shown, one a month earlier (1893) and one a month later (1816) than usual.
There are also intriguing patterns within the general harvest period. For example, 20 September is greatly over-represented compared to either 19 September or 21 September, and no harvest is listed as starting on either 8 September or 8 October. Perhaps these patterns relate to not officially starting work on commemorative dates. For example, 21 September 1792 was during the French Revolution, and on that date the National Convention declared France a republic and abolished the absolute monarchy. Similarly, on 8 October 1453 an agreement was signed whereby the bastille of Bordeaux would be handed over to the French, along with all prisoners in English hands, thus marking the end of English rule of Gascony (where Bordeaux in located).
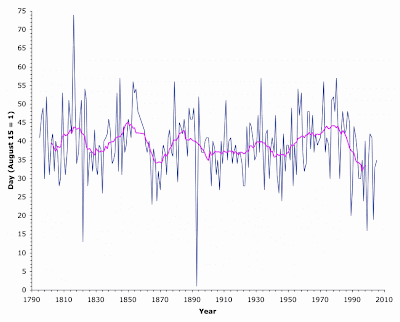
The starting-date data can also be plotted as a time series, as shown in the final graph. The harvest-start dates have been numbered 1-75, so that 1 = the earliest starting date. Once again, the blue line connects the data points, whereas the pink line is a running average (it shows the average value across 9 years).
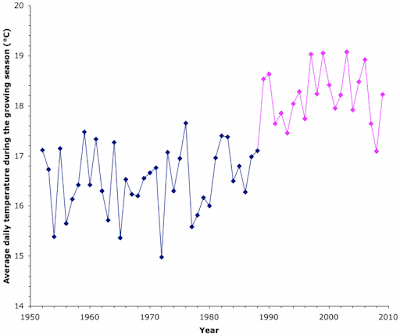
There are two patterns worth noting here. First, the data show long-term cycles (ie. peaks and troughs), with peaks every 35 years during the 1800s and peaks every 45 years during the 1900s. This presumably relates to long-term patterns in the weather. Second, the recent harvests (since 1990) have been among the earliest ever. This coincides with the generally higher quality of the vintages during that time. This is a consequence of the generally warmer weather (see the post on Fifty years of Bordeaux vintages), as the grapes ripen faster and therefore need to be picked earlier.
