Monday, January 31, 2022

Did US imported sparkling wine recover from the Great Recession?

The wine industry has been concerned recently by changes in patterns of wine sales, often associated with the Covid-19 pandemic (but also changing generations of consumers). Sales of certain wines have taken a dip in many regions, which is of obvious financial concern. Recovery seems to be on the way in many respects, although it may not be fast.

Example "recovery" graphs

This raises the general question as to how recovery of sales occurs, on those occasions when it does occur. The general scenario I will discuss is this: a growth of sales is interrupted by some adverse event, followed some time later by a return to growth of sales. Well, there are several ways that this return can occur, two of which are illustrated in the graph above.
  1. For example, the new growth in sales may be exactly the same as before the event, so that, in effect, the main thing the event did was delay things in time.
  2. Alternatively, the new growth in sales may be faster than it was before, so that the sales make up for lost time, and get back onto the original track (see the above graph). This nullifies the effects of the event, and may be called “full recovery”.
  3. The third possibility is that the new growth in sales may be slower than before, so that the sales never recover their former impetus, resulting in an ongoing net loss of sales (see the above graph).
Some data were recently made available that allow us to investigate these ideas, for one particular scenario within the US wine industry — French sparkling wine imported into the USA this century.

The following graph shows the US$ value of the monthly imports into the USA of sparkling wine from France, from January 2002 to November 2021. The data are from the U.S. Bureau of Census (USA Trade Online), via the AAWE. Each point represents one month, while the pink line shows the continuous 11-month average value (ie. centered on each point).

French sparkling wine sales in the USA

Clearly, there was growth of sales until the U.S. Recession; and during 2008 and the first half of 2009 there was a serious dip in sales. According to Wikipedia, the Great Recession began officially in December 2007 and lasted until June 2009 (Great Recession) — the US stock market crashed during 2008, and US unemployment reached 10% in 2009 (The Great Recession of 2008 explained with dates).

The growth of wine sales then recovered, until the end of 2019, when a second dip occurred. At this time, the US government had decided to apply a 25% tariff on French, Spanish, German and British wine, as part of the Airbus subsidies dispute (How will the new US tariff impact the wine market?). This was then resolved somewhat by a truce (US and France agree tariff truce for a year). This latter dip shows a full recovery of previous sales almost immediately.

However, the first dip is another thing altogether. There is clearly a long and protracted delay in recovery. My question here is a simple one: did sales growth from August 2009 until December 2019 occur at the same rate as it was previously (from January 2002 until December 2008)? The alternative seems to be that the growth rate was faster, indicating a recovery of sorts.

To answer this, I need to define the relevant subsets of my dataset, which are shown in the next graph. The data for the first increase in sales are shown in pink, and for the second growth in blue. The dark points (the dips) are not included in the calculations.

Analysis of recovery pattern

I then ran separate regression analyses of the two subsets of the data, assessing linear growth of sales through time. The resulting equations are listed on the graph, with the top line representing the first growth phase and the bottom line the second growth phase. The two regression slopes are different, with the one for the blue data being higher than for the pink. So, I conclude that there has been recovery of sales impetus, albeit a slow one.

To make this concrete, back in August 2009, the expected forecast of sales would have been US$49.0 million (based on the top regression line), but was in fact US$29.6 million (based on the bottom regression line). This is our estimate of how big was the immediate effect of the Recession on French sparkling wine sales — a hefty reduction of 40%. In contrast, the expected forecast of sales for January 2022 would have been US$89.9 million (based on the top regression line), but was in fact US$75.5 million (based on the bottom regression line) — a reduction of only 16%.

So, it seems that, in this case, “recovery” of sales growth occurred to the tune of 3/5th. The US is not yet “back to where it was” before the Recession, as far as the French are concerned, but it may yet get back the remaining 2/5th, if things continue as they are. How things do proceed depends, of course, on the current pandemic. For example, note that in the graph the sales for October and November 2021 set new record highs (Champagne exports hit record high, bouncing back from Covid slump).

Monday, January 24, 2022

Where are Italy’s vineyard areas going?

In the wine industry, people have become increasingly aware of what can be called The Great Grape Migration, resulting from agricultural declines due to climate change (Diversity buffers winegrowing regions from climate change losses). Indeed, in the northern hemisphere, Climate change pushes winemakers north. There has been much less talk about the southern hemisphere; so, here I will look at the north only.

The issue is, of course, that grape varieties each have a set of temperature preferences (both upper and lower) for producing high-quality wine-making grapes. If the climate changes, then the best varieties in any given area likely also to change.


However, there is also another potential phenomenon in play. Entire vineyard areas might change in size, as they change their suitability for grape-growing (ie. net loss of area). This is a difficult idea to study, because there are many factors that affect the choice of vineyard locations. However, here I will look at some data that suggest that the phenomenon might be worth looking into in more detail.

We can start by looking at the recent decrease in vineyard area in the three biggest grape-growing countries of the world (although note that China is now seriously challenging them in size). The data for the first graph are taken from Il Corriere Vinicolo: Vino in Cifre No. 11 (2021).

Declining vineyard area in Europe

In all three regions, the vineyard area has decreased this century, up until c. 2015. For Italy, the decrease was c. 20% between 2000 and 2015, with an increase of c. 5% since then. The publication cited above explicitly notes that 2009–2011 were years of grubbing up of vines, with official compensation. Moreover, since 2016 there has been a licensing system for vineyards.

So, where have the Italian vineyards gone? The same publication provides data for the eight regions (out of 21) with the largest vineyard areas, as shown in the second graph.

Changing vineyard area in Italy

Clearly, the biggest decrease in area has been in Sicily, down 30% since the turn of the century. The biggest increase has been in Veneto, up 40%, along with Friuli Venezia Giulia, up 45%. A quick glance at a map will convince you that Sicily is the southern-most region, while the other two areas are among the northern-most in Italy. Indeed, along with Trentino Alto Adige (up 11%) they cover the Dolomite Mountains of north-eastern Italy, thus providing a bit of altitude, as well. The other large northern Italian regions (Lombardia, Piemonte) are on the flatter western hills — where there has not been much change in vineyard area.

One could possibly see this as a move towards higher-quality wines; and this bears looking into. Much of the reduction in Sicily has been in the south-western corner, in the Marsala region, well-known in the past for favoring high production of somewhat oxidized wines. On the other hand, places like Mount Etna have been booming (Sicily turns up the (wine) heat).

However, this does not mean that good-quality wines cannot be made in the south-west of Sicily, or anywhere on the island, for that matter (eg. see Sicily is Italy’s leading wine region — here’s why).


Indeed, from the south-west I particularly like the Grillo Parlante white, from Fondo Antico. This is a pun name, as “grillo” is the Italian name of both a grape variety and crickets. Il Grillo Parlante (The Talking Cricket) appeared (un-named) in Carlo Collodi’s (1883) book Le Avventure di Pinocchio — he acquired a name in the (1940) Disney movie Pinocchio. Fondo Antico also produces Memorie Rosato, which is a rosé that is not released until it is 5 years old — not many companies would try that!

Anyway, it will be interesting to see how the vineyard areas of Italy continue to relocate, and just how much of the impetus comes from climate change, as opposed to changing tastes in preferred wine styles. There is also the issue that Overall consumption of alcohol in Italy is decreasing; but that is a separate topic.

Monday, January 17, 2022

How much does wine contribute to total exports?

Economically, national Gross Domestic Product (GDP) = consumer spending + government spending + investment + net trade. This economic concept has been of especial interest over the past couple of years, because the Covid-19 pandemic has notably reduced the GDP of most countries. Of interest in this blog post is the bit about Net trade, which is the sum of exports minus imports. How much do wine exports contribute to the national exports, and thus to GDP?

Note that here we are talking about goods or commodity exports — nations often export services, as well, that can generate national income. Also, wine exports are not necessarily related to national wine production, since re-export is a big business for some locations.


The data used to visualize exports come from the UN Comtrade: International Trade Statistics database, via the AAWE (Leading wine exporting countries: value and share of wine exports in 2020). In the graph below, the value of national wine exports in 2020 is shown horizontally, in million United States dollars (note the logarithmic scale), with the percentage contribution of those wine exports to total national exports shown vertically — each point represents one wine-exporting country.

As can be seen, for the vast majority of the countries wine contributes <0.5% of the total national commodity exports, as most people might expect. However, there are 17 countries labeled in the graph, some of which exceed this level considerably. The USA is also labeled, for reference.

Wine as a part of national goods exports

France (FR), Italy (IT) and Spain (ES) have long been the biggest wine exporters, both in terms of dollars (as shown here) and in terms of volume (in which case Spain is no. 1). Needless to say, wine is therefore an important component of national export dollars, although it it still in the region of only 1—2%. Australia (AU), the fourth biggest value exporter, is in the same financial boat.

However, the USA (US) and Germany (which is the point to its immediate left in the graph) are both relatively large wine exporters, but wine makes only a minor contribution to the total export value (<0.1%). Industrial exports contribute heavily, of course, to these big-time manufacturing nations.

South Africa (ZA), Latvia (LV), Lithuania (LT) and North Macedonia (MK) export progressively less wine, but wine still makes the same sort of contribution to national dollars as it does for Spain and Australia.

Portugal (PT) and Argentina (AT) are in the same export-value league as Australia and South Africa, but their wine exports are considerably more important nationally, about the same percentage level as for Italy. However, note that wine's share of Italy's total commodity exports has been growing, as shown by the AAWE (Wine's share of Italy's national commodity exports, 1994–2020), at least partly because Italy's overall exports have not changed for the past decade but Prosecco exports have boomed.

Chile (CL), and especially New Zealand (NZ), leave the other major exporting nations behind, as their wine contributes greatly to national export dollars (2.5% and 3.5%, respectively), even more than for France (2%). It is not surprising, then, that these two countries are major promoters of their vinous products, internationally — it is a good return on investment.

Among the smaller exporters, notably Togo (TG), Montenegro (ME) and China Macao (MO) also have wine contributing a largish amount to their export dollars. Obviously, in the latter case it is re-exports of imported wine, rather than local production.


This leaves us with Moldova (MD) and, especially, Georgia (GE), just across the Black Sea from each other, as the nations who benefit most from wine exports (5.5% and 6.5%, respectively). Neither country is a big exporter, but neither country is a particularly big exporter of anything else, either.

According to the Observatory of Economic Complexity (OEC), in 2019 Moldova was the number 138 economy in the world in terms of GDP. It's top exports were (in order) insulated wire, sunflower seeds, wine, corn, and seats; and the biggest customers were Romania, Russia, Italy, Germany, and Turkey. For wine itself, the biggest export markets were Belarus, Georgia(!), Russia, the UK, and Czechia.

Georgia is usually considered to be the cradle of wine-making, all of 8,000 years ago; and it is apparently still going strong. According to the OEC, in 2019 Georgia was the number 116 economy in the world in terms of GDP. It's top exports were (in order) copper ore, cars, ferroalloys, wine, and packaged medicaments; and the biggest customers were Russia, Azerbaijan, Armenia, Bulgaria, and China. For wine itself, the biggest export markets were China, Poland, and Belarus, but many other markets are increasing, including the USA, the UK, Germany, and Moldova(!). Mike Veseth has some recent coverage of Georgia's wine export scene (Anatomy of Georgia's wine export surge).

Monday, January 10, 2022

Brexit and its effect on the UK’s wine exports

When Great Britain was part of the European Union (EU), my wife used to go there regularly, for meetings of the European Medicines Agency (EMA). This organization was officially housed in London, at the time, and the representatives of the different EU countries would go there for their meetings.*

When Brexit was announced, the EU immediately arranged to move the EMA; and The Netherlands volunteered to build a new office building. This all happened before the original Brexit deadline; but nothing happened at the British end. Britain had made almost no moves to complete Brexit; and subsequently asked for an extension (just like you used to do with your reports at school). This gives you a clear idea about the enthusiasm of the Brits for Brexit — almost none at all.


Britain was a member of the EU for 47 years (1973—2020). Most people don’t know it, but their first referendum about membership was in 1975, although it was the 2016 one that counted. Since then, having voted to leave, by a very small margin (52% of the c.70% of the people who voted; UK votes to leave the EU), they have since had to live with the consequences. There was an official Brexit transition period during 2020; and their relationship is now governed by the EU-UK Trade and Co-operation Agreement that took effect this past year.**

This means that the UK moved from being the beneficiary of the EU free-trade agreements (among the member countries as well as with outsiders) to being the casualty of trade restrictions. For example, their customers in the EU must now pay import duties to receive UK wine, while UK residents have to deal with excise duties to receive EU wine (The noise and the reality); and, perhaps just as importantly, they have lost the shared labor agreement, which included seasonal workers.

There have been continual reports of just how negative the outcomes have been.*** If we look at Gross Domestic Product (= consumer spending + government spending + investment + net exports), then Brexit has been estimated to have caused a 4% reduction (How has Brexit been going?). This compares to a 2% reduction in GDP due to the current pandemic — sad, isn’t it, that the pandemic makes Brexit look good, because everyone else is also in a financial mess (eg. the GDP of the United States in 2020 was –3.4%, the biggest drop since the end of WWII).

The most obvious factor in the UK’s GDP is the loss of net trade (exports minus imports), arising from their removal from all of the free-trade agreements that the EU has in place (Brexit has been a disaster for Britain as collapsing European trade puts UK firms out of business).

UK wine exports since 2000

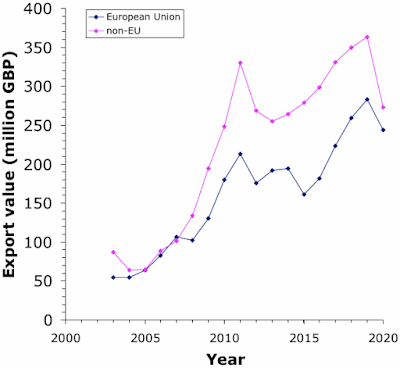
One place that this effect can be clearly seen is in UK wine exports, which we will look at here. The UK has increasingly provided glowing reports of their wine exports, mainly sparkling wines (England gains foothold as sparkling wine producer). Well, as you can imagine, without trade agreements, these exports have taken a nose-dive. The data for the first graph come from Statista (Value of wine exports from the United Kingdom from 2003 to 2020). As you can see, there was a general increase in annual export value until 2019, followed by a nose-dive in 2020.**** This applies to both EU (14% reduction) and non-EU (25%) wine exports, for an overall reduction of 20% from 2019 to 2020. Ouch!

We can investigate this further by looking at some of the main countries concerned in these exports. The next pair of graphs come from the UN Comtrade: International Trade Statistics database, and refer to the seven largest export markets for UK “Wine of fresh grapes, including fortified wines” (Jan. 2010 to Sep. 2021). The first graph refers to the four EU countries, and the second graph to the three non-EU countries.

Recent UK wine exports to four EU countries

Recent UK wine exports to three non-EU countries

As can be seen, the monthly exports to the EU countries do take the expected further nose-dive immediately after December 2020, at the end of the transition period. The average 2021 export values compared to 2019 are: Germany 8.5%, Netherlands 25%, France 53%, and Ireland 58% (Denmark was next, at 52%). The equivalent data for the non-EU countries are: Hong Kong 99%, Singapore 155%, and the USA 83% (Japan was next, at 77%).

So, the loss of the EU markets plus the USA has decimated the UK's wine export values.

The UK now has to re-negotiate all of it's trade agreements. This is turning into a long and arduous process; although as far as wine is concerned, they now have a new agreement with Australia (Free Trade Agreement supports Australian exports to the United Kingdom), which, in turn, desperately needs somewhere to replace its China market (China slams Australian wine with 218% tariffs for 5 years).


The obvious thing for the UK to have done about the loss of their free-trade agreements would be to re-join the European Free-Trade Association (EFTA), currently consisting of Iceland, Liechtenstein, Norway, and Switzerland, Indeed, the UK actually helped found this group way back in 1960, along with Austria, Denmark, Norway, Portugal, Sweden, and Switzerland. This was when the European Economic Community (EEC) was being exclusive, and none of these countries could get in. When the EEC expanded to became the EU, only the current four of the EFTA countries did not join. However, the EU nixed this idea of the UK rejoining the EFTA; they thus need to start pretty much from square one.

Anyway, a recent survey suggests that 51% of the UK populace say they would vote for re-entry to the EU (One year on from Brexit, poll finds voters believe it has harmed UK’s interests) — it's not much of a change in percentage, but it produces a seriously different outcome.


* This was handy for me, because I had Australian wines sent to her hotel, and she then brought them back in her luggage — the UK has a broader selection of Australian wines than anywhere else in Europe.

** This has not been going well, either (The Johnson factor).

*** There are sad stories about individual companies (Brexit: ‘the biggest disaster any government has ever negotiated’); and even the schoolchildren no longer visit (‘Almost unsaleable’: slump in school trips to UK blamed on Brexit).

**** The dip in export value a decade ago was, of course, due to the global recession.

Monday, January 3, 2022

Which countries prefer organic wine?

The growing popularity of organic wine is one of several trends being observed in the global wine market in recent years. Like other certified organic agricultural products, organic grapes need to be grown without artificial pesticides, herbicides, fungicides, or chemical fertilizers. I have previously noted that organic (and biodynamic) wines are often assessed as tasting better than conventionally made wines (Do biodynamic wines taste better than organic wines?), and this would make them even more desirable to consumers.


This leads to the obvious question about who is currently drinking them — are consumers in some locations showing preferences for organic wines, and others not?

As noted by Vinex (Top organic wine markets by volume 2020), the IWSR has recently released its IWSR Organic Wine Report 2019, which addresses this issue. It notes that the 2019 market was definitely concentrated in only a few places. Indeed, the the top ten organic wine markets accounted for 80% of global sales, and the top five account for over 60% of the global total.

Top countries for organic wine volume

The volume data are shown in the first graph, for the top ten countries. Clearly, Germany and France dominate, followed by the UK, the USA and Sweden. This is an eclectic collection of countries, possibly with different motivations. A recent study (Analysis of German wine consumers' preferences for organic and non-organic wines) noted that: “Socio-demographic factors (e.g. age and social class) and behavioural attributes (e.g. frequency of wine consumption and involvement with and preference for other organic products) demonstrate the differences between consumers of organic wine [and] those who do not drink organic wine.”

The IWSR notes that, in Germany, organic wine is particularly purchased by women, people over 50, and high-income earners. In France, popularity for French organic wine is mainly in the large metropolises. The UK combines these characteristics, with organic wine popular among wealthier people located in the cities (who often prefer other organic products, as well). In the USA, buyers seem to be among females, millennials, and high-income earners.

However, what is equally important is that these countries vary dramatically in population size. This obscures just which groups of people are showing a preference for organic wines (the volumes hide the preferences). The thing we need to do is, then, to work out the per capita volumes, which will tell us exactly what we want to know. The volume data divided by population size are shown in the second graph.

Top countries per capita for organic wine

Clearly, two different countries come to the fore. Sweden dominates the graph, with more than 2¼ times the preference of the second country, Austria. France and Germany still do well, but the UK and the USA fade from the picture, somewhat. Sweden has long been known for its consumption of organic wines (Swedes drink more organic wine than other Europeans, research shows), but I have not often seen Austria high-lighted before.

This leads to the obvious question about just why Austrians, and especially Swedes, go for organic wine. At least in the case of Sweden, where I live, it seems to me that important factors include obvious support for environmental conservation and sustainable agriculture, and a preference for chemical-free foods. In that sense, it is a lifestyle choice, where all organic products are to be preferred, not just wine. However, organic products are not cheap in Sweden, so a certain financial credibility is needed for this lifestyle.

Similar factors also seem to apply to Austria, as it has long been a Leader in the natural wine movement. Remember, it was an Austrian, Rudolf Steiner, who first developed the idea of biodynamic farming (way back in 1924). So, the Austrian consumers certainly have plenty of organic wine choice (Austria ‘one of the most exciting countries in Europe’ for orange wines).