Monday, May 27, 2019

Which countries consume the most premium wine?

Most of the wine sold on this planet fits into either the Low-price or the Value categories, which cost less than $10 or €10 per bottle. At the other end are the Premium, Super-premium, Ultra-premium and Prestige categories (for alternative category names see the post How many wine prices are there?). The latter wines are often grouped as "Premium-plus", which group exceeds $20 or €20 per bottle.

This combined group is the topic of this post. Which wine-drinking countries seem to preferentially consume premium-plus wines? The answer may surprise you.


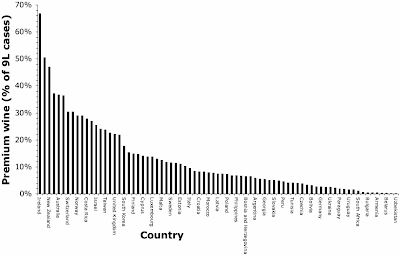
The information comes from The International Spirit and Wine Record. The graph below shows the data for those 78 countries where estimated wine consumption exceeded 1 million 9-L cases (a dozen bottles) for the year 2017. The vertical bars show us the estimated number of premium-plus wine cases as a percentage of the total number of cases of wine. [Note: only every second country is labeled.]

Countries that consume the greatest proportions of premium wine.

Globally, premium-plus wine consumption comprises only 13% of the wine market. However, there are two countries where premium wine sales exceed 50% (Ireland and Hong Kong), and 6 countries where sales exceed 33%.

Most of the top 15 countries do not produce much wine of their own, and thus are importing the premium wines, except for New Zealand and Australia. These are the countries where 2017 premium-plus sales exceeded 20% of the wine market:
Ireland
Hong Kong
New Zealand
Canada
Australia
Singapore
Switzerland
Denmark
Norway
Japan
Costa Rica
Puerto Rico
Israel
Malaysia
Taiwan
United States of America
United Kingdom
Thailand
66.9%
50.5%
47.1%
37.2%
36.7%
36.5%
30.4%
30.3%
29.0%
29.0%
27.9%
26.9%
25.5%
24.1%
23.8%
22.6%
22.3%
21.9%

What on earth are those Irish doing!? They are well known for being connoisseurs of Guinness beer and Irish whiskey, but apparently when they drink wine they overwhelmingly prefer fine wine, as well. Who would have thought it?

It is pleasing to see the Australians and New Zealanders setting the standard for the wine-producing countries. There is probably an expectation that local wine consumption in many regions will preferentially be for simple table wines; but the Australians and New Zealanders do not follow this European-inspired approach, but follow much more the approach of the wine-importing cultures, with a much more marked preference for finer wines.

I have noted before that The USA imports more expensive wines than anywhere else, both by volume and by value. This is because of the large population size, which generates large wine importation. Obviously, the U.S.A. drops down the list when adjusted for population size (as shown above).

There are a number of other regions with small wine consumption that also have notable preferences for premium-plus wines, including: Bermuda (70.5% premium), the Cayman Islands (58.6%), Saint Vincent and the Grenadines (52.2%), Grenada (45.1%), and the U.S. Virgin Islands (43.4%) (but not so much the British Virgin Islands, 24.6%).

The countries at the bottom of the list include some well-known wine-producing and wine-consuming countries, notably: Germany (2.7% premium), Portugal (2.2%), Romania (1.7%), and South Africa (1.1%). Compare these figures with those for the biggest wine producers: Italy (9.6%), France (7.8%), and Spain (6.7%), where simple table wines comprise most of the wine consumption.

Sadly, I must note the poor performance of Sweden (11.6% premium), compared to the data for their Scandinavian neighbors, Denmark (30%) and Norway (29%), and even Finland (14.9%). I do my best to drink only fine wines, but it is obviously not enough!

Monday, May 20, 2019

In which countries is wine the greater part of the alcohol market?

Actually, there appears to be only one country where wine is >50% of alcohol sales, by volume — Italy.


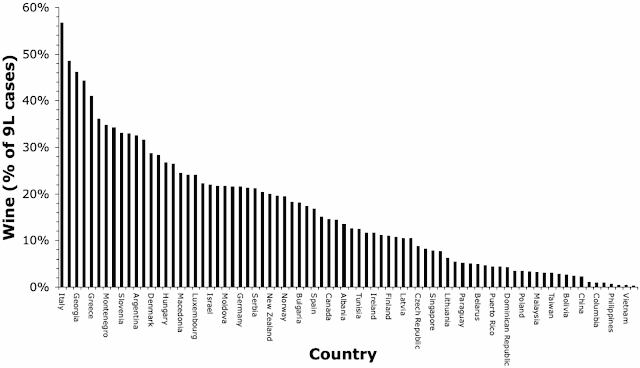
This information comes from The International Spirit and Wine Record. The graph below shows the data for those 78 countries where wine sales exceeded 1 million 9-L cases (a dozen bottles) for the year 2017. The vertical bars show us the number of wine cases as a percentage of the total number of cases of alcohol (i.e. including beer and spirits). [Note: only every second country is labeled.]

Countries that consume the greatest proportions of wine.

Globally, wine consumption comprises only 10% of the alcohol market. There is only one country where wine sales exceed 50%, and only 8 countries where sales exceed 33%.

Of the top 5 countries, 4 are in Europe; and 8 of the top 10 are located there (as are 14 of the top 20). These are the countries where 2017 sales exceed 20% of the alcohol market:
Italy
France
Georgia
Portugal
Greece
Switzerland
Montenegro
Uruguay
Slovenia
Malta
Argentina
Morocco
Denmark
Uzbekistan
Hungary
Sweden
Macedonia
Belgium
Luxembourg
Chile
Israel
Netherlands
Moldova
Austria
Germany
Australia
Serbia
Romania
56.6%
48.5%
46.1%
44.3%
41.0%
36.1%
34.7%
34.2%
33.1%
32.9%
32.5%
31.6%
28.7%
28.3%
26.7%
26.4%
24.4%
24.1%
24.1%
22.2%
22.0%
21.7%
21.7%
21.6%
21.6%
21.3%
21.1%
20.4%

Surprisingly, Spanish sales are at only 16.8%, which is unexpected for one of the world's top-3 wine producers — compare with Italy at 57% and France at 48%. Even some of the top importers are at relatively low levels, with the USA at 10.4% and the UK at 17.3%.

The countries at the bottom of the list are mostly those where beer consumption predominates, including India (0.3% wine), Vietnam (0.4%) Thailand (0.4%) and the Philippines (0.6%). The biggest potential wine markets include those with extremely large populations but currently low wine percentages, such as India, China (2.3%), Brazil (2.4%), and Indonesia (3.1%). Mind you, the USA currently seems determined not to participate in the Chinese market.

Other countries with low percentages have traditionally been known for relatively high spirits consumption, including Poland (3.4% wine) and Russia (7.7%). Indeed, this is why some of the Nordic countries long ago introduced government alcohol monopolies, to try to get people away from binge drinking of spirits, and move them to lower-alcohol beverages such as beer and wine. They seem to have succeeded: Sweden (26% wine), Norway (19.4%), and Finland (11.0%). Beer is therefore probably the most popular beverage in these countries.

Monday, May 13, 2019

A century of French wine vintages

A few weeks ago I discussed the topic of quality scores for different vintages from particular wine-producing regions (How different are regional vintage quality-scores from different sources?). These Vintage Charts are intended to tell us how the wine quality has varied from vintage to vintage, for each region. They naïvely simplify the complexities of each harvest (where there can be considerable spatial variation) down into a single number; but nevertheless, they can be an interesting and informative guide to the general quality of each vintage, especially if they cover a long period of time.

In this post I will use the information from one specific vintage chart, to look at the variation over the past century for the vintages from the most prominent wine regions of France (see Which French wine region is right for you?).


The Cavus Vinifera web site markets a wine-cellar management tool (also available in English as Your Cellar). Along with lots of other information, the site contains vintage charts for several of the wine-producing regions of France, mostly from the year 1900 up to a couple of years ago (Les millésimes en France de 1899 a nos jours). This is very unusual, as most vintage charts cover a much shorter period of time. This circumstance thus provides the opportunity to compare these French regions over the past century, to investigate to what extent vintage variation is correlated among these areas.

Almost every vintage from 1900-2014 has been rated on a scale of 0-20. The regions and wines covered by the entire time-span include:
   Bordeaux (red)
   Bordeaux (white)
   Bordeaux (sweet)
   Burgundy (red)
   Burgundy (white)
   Rhône (North)
   Rhône (South)
   Loire (red)
   Champagne
   Beaujolais
   Alsace
The data are incomplete for the Loire (sweet) and South-West regions, which I have thus left out of my analysis.

As I did in my previous post on the topic, I have used a network to visualize these data, with the network being used as a form of exploratory data analysis. I first used the manhattan distance to calculate the similarity of the different wines, based on the quality scores. This was followed by a neighbor-net analysis to display the between-region similarities as two phylogenetic networks.

The network for the 11 wines / regions is shown in the first graph. Each wine type is represented by a dot in the network. Wines that are closely connected in the network are similar to each other based on the variation in their vintage quality scores through time, and those that are further apart are progressively more different from each other.


Not unexpectedly, many of the different wines from the same general regions do form neighborhoods in the network. For example, the three wines types from Bordeaux (in south-western France) are together; as are the three wines from Burgundy and Beaujolais (along the Saône River in eastern France); and the two wines from the Rhône River (in the south-east). Thus, we may conclude that broad-scale regional conditions do, indeed, affect the different grape types in a similar fashion.

However, the network location of the other three wines is less easily explained. For example, the Loire reds (from western France) are associated with the Rhône wines; the Alsace wines (from north-eastern France) are loosely associated with the Bordeaux wines; and the Champagne region (in northern France) is somewhat isolated. If I had been asked to guess beforehand, I would have expected the Alsace, Champagne and Burgundy wines to have similar vintage variation, based on their geographical proximity. So, why does the network reveal something quite different? There is something worth looking into here.

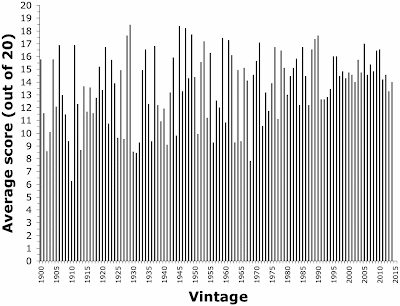
The network for the 115 years is rather a simple graph, which mostly just shows the same pattern as a graph of the annual vintage quality-scores averaged across all of the regions. This does, in fact, mean that a vintage chart for the whole of France could be generally useful. So, I have shown the simple annual averages in this next graph, instead of showing the network.

Average quality scores for the past hundred years of French wine vintages.

The poorest French vintages include 1902, 1910, 1913, 1930, 1931, and 1968. The best French vintages include: 1929, 1945 and 1947, followed by 1928, 1949, 1989 and 1990, and then 1906, 1953, 1959, 1961 and 2005. The 1910 vintage stands out as particularly poor, with none of the regions scoring more than 10 out of 20 for their grape harvest, and both Burgundy wines scoring 0! This contrasts with the best years, where no region scored less than 16 out of 20. Some of the top years are still revered by connoisseurs, at least for some of the regions.

Note that the 1930s were generally not a good time for wine-making in France, and nor were the 1910s (although 1906 was an early-century exception). The 1940s and early 1950s, on the other hand, were generally good times for wine production. Moreover, there has not been a bad vintage since the end of the 1960s, or even a mediocre vintage since the early 1990s.

Indeed, this graph shows one of the clearest effects of climate change in France — the consistent elimination of low-quality wine in regions that have traditionally been considered marginal. Marginal growing conditions have always been considered desirable for high-quality wine-making, but this comes at the risk of poor vintages when the weather is particularly nasty. These days, climate change has created considerable variation in vintage harvest volume, but has reduced the variation in vintage quality. Consistently warm growing weather ensures high-quality grapes, but it comes at the expense of potentially reducing the quantity of the harvest — for example, by late spring frosts (see Frost – the new normal?), lack of rain (see Wine’s emerging water crisis), or even heavy rain.

Climate change is a particular type of weather change, associated with atmospheric warming — it thus increases the variability in some weather characteristics and reduces it in others.

Monday, May 6, 2019

Why online systems for recommending wine seem not to work very well

In the marketing world there is a clear distinction between “buying” and “selling”. “Buying” means that the customer comes to the retailer in search of something specific, and will make a purchase if the item is available at the right price. “Selling” means persuading the customer to purchase something they had not yet realized they wanted.

Most wine is sold, not bought. This post looks at how this happens in the modern world.


There is plenty of wine that is bought, of course, mostly by people with a specific wine interest. They hear about a particular wine, and they go in search of it, or they make direct purchases from wineries, for example, after tasting. Indeed, it seems that: “the online world has been a godsend for boutique wineries, many of which have had their market access stymied by the increased dominance of supermarkets in the liquor retailing scene.”

Selling

But most wine is not bought in this targeted way. This applies to both online and bricks-and-mortar retailing. Most casual drinkers start the purchasing process with little or no specific idea in mind, and it is up to the retailer to sell them something, lest the customer moves on. This should preferably be something that the customer will like, and which is also financially remunerative for the retailer. The latter point is of particular importance, because selling loss-leaders is a no-brainer, and selling high-volume items is a little-brainer — the “art of selling” refers to the remainder of the inventory.

The tricky part is therefore the point about the customers purchasing something they will like. How on earth do we do this? Let's put aside the idea of prior marketing for the moment, which is a whole other business (“Sales is fishing with a hook; marketing is fishing with a net.”) Supermarkets often work in this way.

In the bricks-and-mortar world, one traditional selling method is to have an actual human being talk directly to the customer. In some mysterious way, the seller persuades the customer to leave the store with a bottle of wine of the seller's choice. This may or may not work, depending on how well the seller judges the tastes of the purchaser. It can fail for any number of reasons, including misunderstandings due to words, genetic differences in wine tasting, and psychological factors like social pressure (Wine has a problem because it is “sold.” Badly. Or not at all). Moreover, a large proportion of wine is purchased in supermarkets and grocery stores, where there is no dedicated seller. This has been referred to as the Vino Casino, because getting a suitable wine is then a lot like gambling (“you pays your money and you takes your chances”).

In the online world, on the other hand, the method that has become best entrenched is to have a computerized recommendation system. The customer is shown a series of items that the computer has decided might be of interest, so that the computer system effectively becomes the seller. Instead of an interaction between two people (purchaser and seller), in this case there is little or no interaction at all — the seller presents, and the targeted purchaser reacts.

This general idea seems not to work all that well, currently, often because the recommendations are not relevant most of the time (eg. 90%). However, this does not mean that the online stores do not rely on recommendations for a large part of their revenue — see The promise (and pitfalls) of current recommendation engines.

Online recommendations

How does the computer do this recommending? There seem to be five general ways that allow a computerized recommendation system to function.

The first way is based on “trending”. The idea is to identify things that have recently become popular, and then recommend them to a broader set of customers. That is, the computer system tries to detect things where the attention is accelerating, as opposed to sustained signals in the world of consumers. Twitter, in particular, uses this idea.

The problem with this approach is that it filters out ongoing trends, and focuses instead on the novel and sensational. This has always been the approach of the traditional media, of course — 500 people killed in 500 car crashes is not “news” but a single plane crash gets front-page headlines. This is hardly a useful way to recommend anything sustainable. It is also very easy to “game” such a system, simply by generating a little ersatz velocity.

The second way to recommend is via what is called “profiling”. This means that the fundamental characteristics of the items being sold are determined, usually by an expert. For example, the Music Genome Project tried this approach, in which 450 distinct musical characteristics were coded for each of more than 1 million pieces of music. Recommendations could then be made for new customers, who first specified some pieces of music that they like, and were then told about other pieces of music that have similar musical characteristics.

The first version of this idea for recommending wine was apparently SmartTaste, based on the organoleptic qualities of a set of wines; and this approach was also adopted by the likes of SavvyTaste. Neither system prospered, apparently due to inconsistencies between people regarding the interpretation of the sensorial profiles.


The third approach is therefore to focus on people, using what is called “collaborative filtering”. Each person in the customer database is categorized based on their likes and dislikes. This happens whenever they rate any of the items in the database — they "like" items they rate highly and "dislike" ones they rate poorly. In order to make a recommendation, the new customer is matched to similar people from the database, based on their apparent likes, and recommendations are made based on those similar people's ratings.

Obviously, this approach does tend to promote the idea of stereotypes (eg. recommending wine to females and beer to males), which can create a feedback cycle that entrenches the stereotypes. But the practical problem here is that most of the items have never been rated by most of the people, in spite of the fact that the databases used by the likes of Amazon and Netflix have billions of ratings. This means that the similarity calculations need to be constantly updated as new ratings come in, at the rate of millions per day. This progressively becomes unworkable, as in practice the calculations need to be repeated for each new customer.

The fourth approach is therefore to focus on the items, instead of the people. Each item in the database is categorized based on which people like or dislike it, based on their ratings, and/or which items are purchased together (eg. a set of wine glasses plus a separate decanter). In order to make a recommendation, items that each new customer looks at are matched to other items in the database, and recommendations are made based on how similar those items are, in terms of who likes them or has purchased them.

This is better than option 3, because once there are sufficient ratings for any given item the similarity calculations will stabilize — the calculations do not need to be updated anywhere near as often. This is the basic approach used by most of the recommendation engines, such as those used by Amazon and Netflix.


The failure of this fourth approach comes from the assumption that because one person likes an item that someone else will also like it, in some consistent manner. Take a basic marriage as a counter-example. Mathematically, such a situation might be ⅓ ⅓ ⅓ — one-third of the time the husband and wife like the same thing, one-third of the time the husband goes long with the wife's choice, and one-third of the time the wife goes long with the husband's choice. This will work in practice, because both the husband and the wife are getting what they want two-thirds of the time. However, if an outsider sees the wife and husband together doing something, which of the three possibilities is it? There is only a one-third chance that my wife will like something that I like, in spite of the fact that she is getting what she likes two-thirds of the time. This is not a reliable basis for a recommendation system.

The fifth type of recommendation system therefore gets personal, by focusing on individuals rather than stereotypes (as in the third approach). In effect, what is needed for consistent wine recommendations is to find someone whose wine tastes are the same as your own, and to then follow their advice. This seems quite obvious, and it has been said many times before about the only possible usefulness of wine critics and commentators — for practical purposes, each of them is only as useful as the similarity of their tastes to your own. Unfortunately, how to implement this idea in an automated (computer) system is not necessarily obvious. Both the Tribes and Clans wine-recommendation systems claim to do this; but their inner workings are still subject to patent-application non-disclosure.

Conclusion

Computer recommendation systems are not likely to go away, in the wine industry or anywhere else, because they seem to be the only way to sell things to non-buyers online. We should not, however, conclude from this that they are currently in any way optimal for their intended purpose: which is consistently recommending something that the customer will like. While we wait for improvement, we will need to continue to take their recommendations with a grain of salt.