Monday, August 30, 2021

Trends in US wine consumption over the past decade

Recently, we have been bombarded with reports about the behavior of American drinkers during the current pandemic, many of them apparently at variance with each other. The basic issue is that people vary in their behavior, so that some people might increase their drinking, for example, while others decrease it, and yet others stay the same. So, some people are drinking more, lots of people are buying alcohol online (and not in shops), and restaurants are wondering what to do with their wine collections (given that they have few food customers).


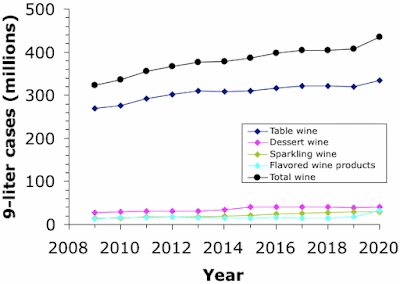
Moreover, most of the data presented tends to compare 2020/21 with only 2019; but what about long-term trends? The data I have used to look at this question comes from Wine Sales in the USA (includes wine shipments from within the U.S. states and foreign producers entering U.S. distribution). It covers the volume of sales over the years 2009 to 2020, inclusive, by category. The first graph shows the total (in black), plus each of the four categories separately.

It is clear that total sales increased steadily over time. For example, sales were 25.6% higher in 2019 compared to 2009, which represents a cumulative increase of 2.3% per year. This greatly exceeded the increase in population over the same period of time, which went up only 7.4% (according to Worldometer). So, the wine industry in the USA was apparently very successful during the second decade of the 21st Century, in the commercial sense, and industry-wide.

Wine sales in the USA 2009-2020

It is also apparent in the graph that there was a distinct up-tick in wine sales during 2020, marking the start of the Covid-19 pandemic. Wine sales increased by 7.0% in that year alone, which was 3 times the annual increase over the preceding decade. Some, at least, of the wine industry accountants are presumably even happier about this.

This does not, of course, mean that each individual U.S. winery is financially happy. For example, it has been reported that Wine sales are up but winery profits down, due to increasing market share by the bigger wineries, along with a pronounced shift to cheaper wines. That is, not all wineries have been in a position to benefit from the increased sales, especially given the noted switch from shop sales to online sales.

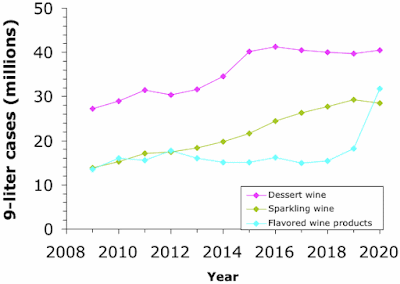
If we now look at the four wine categories individually, we can see that the steady increase in total sales was principally due to table wine, as also was the 2020 up-tick. However, the other three categories were somewhat different, as shown in the second graph, which pulls them out separately.

Wine sales in the USA 2009-2020

We can see that sparkling wine also followed a nice steady increase over the decade, but had a distinct down-turn in 2020, instead of going up. Perhaps not too many people were celebrating in that year: Champagne loses its fizz as pandemic hits sales. Mind you, this could also be part of the shift to less expensive wine: From the pandemic to Prosecco: Why Champagne sales are plummeting; along with the recent export difficulties due to a trade dispute with the USA.

Dessert wine has had a somewhat rocky ride in the graph. The increase in dessert wine sales started in 2013 and ended in 2016; and it has been pretty steady since then, including in 2020. The change in sales may represent a transition from Millennials to Generation Z amongst consumers. That is, it starts with the arrival of late-period Millennials at drinking age, and ends with the arrival of early Generation Z drinkers.

The flavored wine products maintained fairly steady sales for most of the decade. However, a distinct up-turn started in 2019, which then became a boom in 2020. This coincides with the arrival of increasing numbers of Generation Z consumers at drinking age (i.e. those born in 2000/01). Generation Z is formally defined as including those people born from 1997—2012; and they will thus be an increasing component of wine consumers until at least 2030.

This latter point will be interesting if the down-tick in sparkling wine sales is in any way related to the boom in flavored wine products. A recent survey has concluded that: American Gen Z are thoughtful boozers. This apparently means that they do not behave anything like their predecessors, the Millennials (born 1981—1996). For example:
According to the survey, 68% of Millennials — those between 25 and 40 — said the celebrity endorsement influenced their buying decisions, while 86% of the Gen Z buyers said they could care less.
That is quite a difference! In terms of preference for flavored wine products, the report also notes:
RTDs are beginning to drink hard seltzer’s lunch. “While the breakout drink of 2019 and 2020 is still growing, it’s not what 21-plussers say they will reach for first this summer,” Drizly says. “Ready-to-drink cocktails and other new canned drinks are playing off of hard seltzer’s innovation, and, in the process, taking some of its growth momentum.”
Perhaps the biggest issue is that there is reported to be a decreasing level of recruitment among Generation Z wine drinkers in the USA, which may slow any continuation of the patterns shown in the graphs above. Wine marketers have now been warned!
Monday, August 23, 2021

The (unknown) vineyard areas of Asia

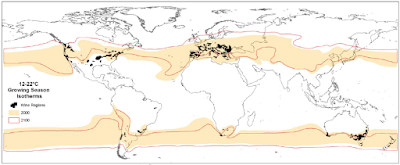
For climatic reasons, vineyards are almost all between 45° S (southern Chile) to 60° N (central Sweden). Within this range, the distribution of those used for wine-making is further limited by climate. For example, Climate categories in viticulture notes:
The climates of most wine regions are categorised (somewhat loosely based on the Köppen climate classification) as being part of a Mediterranean (for example Tuscany[2][nb 1]), Maritime (ex: Bordeaux[3]) or Continental climate (ex: Columbia Valley[4]). The majority of the world's premium wine production takes place in one of these three climate categories, in locations between the 30th parallel and 50th parallel in both the northern and southern hemisphere. While viticulture does exist in some tropical climates, most notably Brazil, the amount of quality wine production in those areas is small.
Indeed, a wine-making map of the world looks something like this:


This is an over-simplification, however, because there are a few grape-growing regions in tropical places other than Brazil and India, notably in Asia. People do not usually know about this, because the areas are so small that they are not often recorded. Even the US Department of Agriculture no longer counts grape hectares in states without very many of them (The wrath grows over grape data).

We can, however, look at a time trend of some of these Asian vineyard areas, by using the Annual Database of Global Wine Markets 1835 to 2018 (by Kym Anderson and Vicente Pinilla), Table T1. These data are shown in the graph, for three tropical countries of south-east Asia, plus Japan and South Korea for comparison, from 1960 onward.

Time-line of Asian vineyard areas since 1960

Only the two non-tropical countries, Japan and South Korea, have ever had much vineyard area, although both have been in serious decline — Japan reached its peak in 1980, and Korea in 2000. There have been a number of recent articles discussing Japanese wine-making, notably The secret history of Japanese wine, and How to cultivate vines in Japan. Of perhaps more curiosity, it has been noted that: In Japan, aging wine undersea speeds maturing — this sort of behavior has not received universal approval (Ocean floor wine company withdraws permit application amid Coastal Act violations).

Perhaps of greater interest is the continuous increase in vineyard area in Thailand since 1975. This has been discussed in: Drinking around the world: The rise and rise of Thai wine. This may have more than a little to do with the fact that the country is a favorite place for Europeans to have a holiday apartment (especially Swedes), and bringing their culture with them. However, this increase also coincides with the first clear signs of rapid global warming (Terroir and global warming), and thus climate change. Of current interest, it has been reported that: 2021 is shaping up to be an exceptional harvest in Thailand.

Wine exports do not always reflect wine production, due to re-export of imports, but the AAWE reports that Thailand exported US$41.0 million worth of wine in 2020, while Brazil exported $8.3 million, India exported $4.8 million, Japan exported $3.2 million, and Taiwan $1.9 million.

In Taiwan, the vineyard area has settled down to a constant level since 2005, allowing Thailand to overtake it. Before this time, independent wine-making was illegal (see Taiwanese wine); and there are currently only a couple of dozen known wine producers. The Western wine media has not shown much interest, so far.

On the topic of Asia, I should also note that China has a wine-making industry, parts of which are shrinking (as I recently noted: So, why has China gone off the boil?) and parts of which are not (eg. Ningxia unveils ambitious plans to expand vineyard area and improve wine quality). The current status of the wine quality is discussed in: How good is Chinese wine? On a related note, you could, of course, also check out A guide to pairing Asian food and wine.


We can expect the vineyard areas of the world to continue to expand into previously unexpected locations. This has nothing to do with human ingenuity, but is simply a response to Global Climate Change. This has become an accepted fact in the wine industry, even if there are skeptics elsewhere, because of the intimate relationships between weather and grape-growing (Climate, weather, and vineyard management).

Likely future changes for the wine industry are summarized in: The effects of climate change on the global wine industry: a meta-analysis for SOMM Journal; and some countries have produced detailed forecasts for their own vineyard areas, notably the Wine Australia Climate Atlas. Coverage of more widespread changes are outlined in the recent IPCC AR6 report.

Monday, August 16, 2021

Where on earth are the organic vineyards?

Like other certified organic agricultural products, organic grapes need to be grown without artificial pesticides, herbicides, fungicides, or chemical fertilizers; if this is not so, then they cannot be certified. Last week, I noted that both organic and biodynamic wines are often assessed as tasting better than conventionally made wines. It has also been noted that Organic grape-growing can be more profitable than the conventional products. So, we would expect that there is an increasing number of organic (and biodynamic) vineyards around the world.


But where are they? Are they principally in certain places, or do all wine-making regions have them? After all, maybe it is the high-quality vineyards that are most worth the extra effort that might be required for organic procedures. Location is not an easy thing to determine, but plenty of data have appeared recently to suggest that certain places are doing better than others. I summarize some of that information here.

We could start with a graph of the Certified organic vineyard area worldwide (from AAWE), showing the change from 2004-2019. The inexorable increase is pretty obvious.


Much of this increase has been within the European Union, the Old World of the wine industry. All of its big production countries have been involved, as shown in this next table (from AAWE) of the areas devoted to organic vineyards in 2018. Most of the countries had devoted about 1/8th of their vineyard area to organically grown grapes, although Germany was lagging at the time.


These percentages will have, of course, increased with the increase in area since 2018. For example, the latest figures for Italy (2021) show 19% of the national total has been certified. This is apparently the highest country percentage of organically certified cultivation in the world.

If we focus on the distribution within this well-known wine-producing country, the next graph (from AAWE) shows the organic area within the different provinces of Italy in 2018. Note that Sicily has twice as much area as Puglia, followed by Tuscany, with the others lagging badly. I suspect that Sicily's success is simply a by-product of the fact that the Industrial Revolution passed the island by; and World War II didn't help, either. My experience there is that many of the wine-production techniques were still old-fashioned even before Organic Vineyards became popular, and so the organic certification must have been relatively painless.


This leads me to ask whether the perceived quality of the wines varies among these different locations. The data I have at hand was covered in my previous post, in which I presented quality scores for 1,682 organic wines from the JamesSuckling.com web site. The average scores from each of the countries are shown in the next table. With an average score of 92.1 across the whole collection, you can see that both Germany and the USA performed very well (although there were not many wines from the latter country).

The average wine-quality scores for the different countries sampled
Country
Argentina
Australia
Austria
Chile
China
France
Germany
Greece
Hungary
Israel
Italy (most)
  Tuscany
New Zealand
Portugal
Slovenia
Spain
United States
Uruguay
No. wines
100
9
169
54
8
316
332
2
5
5
229
331
23
7
1
63
27
1
Av. score
91.4
92.1
91.4
91.2
90.8
91.9
93.7
 
92.6
93.4
91.3
91.8
92.8
91.7
 
91.7
93.1
 

It is worth pointing out that the countries with lots of wines tasted were not necessarily sampled evenly. Most obviously, within Italy, the region of Tuscany accounted for 60% of the Italian wines, and 20% of the total wines. Similarly, 40% of the French wines came from the Alsace region, 60% of the Austrian wines came from the Danube region, and 40% of the German wines came from the Rheingau region. This does not necessarily reflect the relative abundance of the vineyards.

Interestingly, the quality scores of the German wines were very consistently high across all regions. The Appendix at the bottom of this post shows the average scores for each region that had at least four wines tasted. All of the German wine-making regions averaged well above the survey average (range: 92.7—94.9).

Several countries are showing active interest in increasing the quality of their organically produced wines. For example, Chile is forming an organic grape-growers association. Sadly, this highlights some of the problems involved, particularly if organic wines are to be produced in an artisanal manner (To automate, or not to automate? The big question facing Chile’s winemakers).
 
As a final topic, we could look at which counties show a preference for consuming organic wines. The next graph (from AAWE) shows the proportional consumption of organic wine in 2017. It is no surprise that Germany is out front, given the quality of its organic wines. The presence of countries such as Sweden and Japan in the top six indicates that importing consumers have also been educated in the benefits of organic production.


Most interesting, however, is the absence of Italy from the top-listed countries. Indeed, organic wines seem to be very low on the priority list for Italian consumers. The final graph (from AAWE) shows the market share of organically produced goods for various products in Italy in 2020. Some products do commendably well, but wine is not one of them, with organic wines at a measly 1.4% of their market. Even the overall average share (of 4%) is sadly very low.


Clearly, we have a long way to go, getting the world to value organic production. However, with the effects of Climate Change becoming more and more obvious, year by year, the perceived value of organically produced food-stuffs can only increase.


Appendix. The average wine-quality scores for the different regions sampled.

Country
Argentina
Argentina
Argentina
Australia
Australia
Australia
Austria
Austria
Austria
Austria
Austria
Austria
Chile
Chile
Chile
Chile
Chile
Chile
Chile
China
China
France
France
France
France
France
France
France
France
France
France
France
France
France
Germany
Germany
Germany
Germany
Germany
Germany
Germany
Germany
Germany
Germany
Greece
Hungary
Hungary
Israel
Italy
Italy
Italy
Italy
Italy
Italy
Italy
Italy
Italy
Italy
Italy
Italy
Italy
New Zealand
New Zealand
New Zealand
New Zealand
New Zealand
Portugal
Portugal
Portugal
Slovenia
Spain
Spain
Spain
Spain
Spain
Spain
Spain
Spain
Spain
United States
United States
Uruguay
Region
Argentina
Mendoza
Patagonia
South Australia
Victoria
Western Australia
Austria
Burgenland
Danube
Eisenberg
Leithaberg
Steiermark
Aconcagua
Chile
Colchagua
Limarí
Region del Sur
Valle Central
Valle de Maule
Ningxia
Xinjiang
Alsace
Beaujolais
Bordeaux
Burgundy
Champagne
France
Jura
Languedoc
Languedoc-Roussillon
Loire Valley
Provence
Rhone Valley
South France
Franken
Germany
Mittelrhein
Mosel
Nahe
Pfalz
Rheingau
Rheinhessen
Saale-Unstrut
Württemberg
Santorini
Transdanubia
Villány
Judean Hills
Abruzzo
Basilicata
Emilia-Romagna
Italy
Marche
Molise
Northeast
Piedmont
Puglia
Sicily
Tuscany
Umbria
Veneto
Central Otago
Hawkes Bay
Marlborough
Nelson
Waipara Valley
Bairrada
Beiras
Douro
Slovenia
Andalucia
Castilla y León
Castilla-La Mancha
Cataluña
España
La Rioja
Murcia
Spain
Valencia
California
Oregon
Colonia
No. wines
4
89
7
5
3
1
7
11
105
6
9
31
19
7
2
1
2
22
1
4
4
119
39
88
11
1
8
3
5
5
9
12
13
3
40
1
2
41
27
34
110
62
2
13
2
2
3
5
12
4
10
4
5
1
12
76
4
46
331
12
43
9
2
4
4
4
2
1
4
1
1
15
13
9
4
9
6
2
4
24
3
1
Av. score
90.5
91.4
91.9
92.0
 
 
91.1
90.7
91.4
92.3
91.1
91.6
91.1
91.3


91.0
 
90.3
91.3
92.3
91.9
91.5
91.1
 
91.8
 
91.0
90.0
92.4
90.5
92.6
 
93.1
 
 
94.0
94.9
93.9
94.2
92.7
 
93.1


93.4
91.4
91.5
89.1
89.3
92.0
 
90.8
91.8
91.0
90.5
91.8
91.8
92.0
94.1
 
92.3
92.5
93.3
 
 
91.8
 
 
92.8
90.5
90.6
90.8
94.4
90.0
 
91.0
93.2


Monday, August 9, 2021

Do biodynamic wines taste better than organic wines?

We have heard a lot about organic wine in recent years. This is made from grapes that have been grown using what is intended to be a more “natural” agricultural procedure, whereby both the grape-growing and the wine-making try to use ecologically sustainable processes. This apparently produces more artisanal wines, and which might thereby be more palate-pleasing, as well.

We may rightly ask: Do eco-friendly wines taste better? In answer, we have, indeed, been told that: Evidence mounts that eco-friendly wine tastes better. It is thus argued that this is Why certified organic wines are worth the search. Indeed: “Organic wine-making is all about taking away the shadow and mystery from that translation of a vineyard into the glass ... [the wines] really show the place, down to almost the row” (Why organic Shiraz is a true taste of terroir).


Beyond organic wine, there is biodynamic wine. Biodynamics is intended to take the basis of organics to another level, apparently with the intention of moving closer to some sort of spiritual (metaphysical?) ideal of do-nothing farming and wine-making. Given their intended superiority, we could reasonably ask whether these wines actually taste better than do organic wines; but the literature answering this question is much less clear.

So, it seems worthwhile to look at some data, in which the same people have tasted both biodynamic wines and organic wines. In this regard, wine-quality scores from reputable online sites are of value, provided we can get enough such scores. The quality of the wine tasting procedure is important, of course; but when it comes to plotting a meaningful graph, quantity certainly helps, as well. The people at the James Suckling site have certainly been busy this year, with: 12,000 wines rated, 13,000 to go: The year to date; so we could look at their data as an example.*

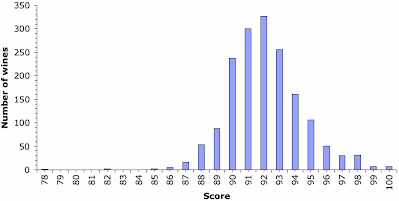
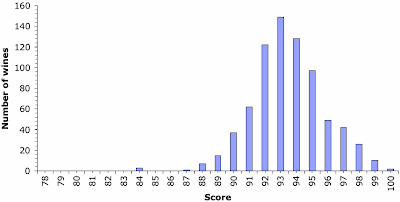
Recently, they produced a report on: 12 months of organic ratings: Uncovering some of nature’s finest. This report covers 1,682 wines labeled as organic, with an average score of 92.1 points (and a median of 92). They have also produced a report on: Rating biodynamics: Finding the true soul of wine. This report covers 750 wines labeled as biodynamic, which is 45% of the organic sample size, with an average score of 93.5 points (and a median of 93).

The first graph below shows the data for the organic wines, with the quality scores horizontally, and vertically a count of the number of wines at each score. The second graph shows the data for the biodynamic wines.

JamesSuckling.com tasting of organic wines

JamesSuckling.com tasting of biodynamic wines

As expected from the data summaries listed above (average and median), the scores for the biodynamic wines are shifted to the right in the graphs, compared to the organic wines. That is, in general, the biodynamic wines do get higher quality scores than the organic wines. Note that this conclusion is independent of whether the James Suckling site tends to give higher scores than do other wine commentators (as has sometimes been suggested), since we are comparing the scores within the same group of wine tasters.

It thus seems reasonable to anticipate that, at least at the moment, organic wines taste better (on average) than do conventional wines, and biodynamic wines taste better (on average) than do organic wines. The future looks better for both the environment and for our taste buds.

This is not to say that these attempts at ecologically sustainable agriculture are without problems. Most of these problems have to do with grape-grower responses to disease. The viticulturalists are not supposed to be spraying their vineyards with modern chemicals. As noted by Tony Ingle (Angove chief winemaker, in South Australia):
If you’re going to be doing it in a region that’s got a lot of disease pressure, then it starts getting really hard. You have to start spraying things a lot, which is why we do it in the McLaren Vale, where there is very low disease pressure ... With organic grape-growing, yes you’ve got to be a little bit more careful, you’ve got to walk through the vineyard a bit more often to see what’s happening, and you’ve got to react when you see things making a problem.
This has become increasingly obvious this year, with, for example, Downy mildew becoming widespread in Champagne and the areas north of there. We may therefore ask: After the storms — do organic rules need to be rethought? (“you have to expect the unexpected; and that makes commitment to organic farming very difficult”). After all, for natural wine, everything depends on Nature; and Nature has the last word.


* Note: I do not have direct access to the JamesSuckling.com database. For my blog posts, I independently extract the data from the online web pages, just like any other reader. This hopefully avoids any potential conflicts of interest; however, access to these pages was kindly provided by James Suckling, for which I am grateful.

Monday, August 2, 2021

Males used to drink more alcohol than females, but not any more

Physically, biological organisms are a collection of intricately co-ordinated chemical reactions. These biochemical reactions (as they are called) can only function effectively within certain limits. That is, there is always a situation described as “not enough” and another described as “too much”. For example, too little water means that we die of dehydration, and too much water means that we die by drowning — we need to keep ourselves between the two, if we are to stay alive.


For alcohol, the lower limit is zero (we don't actually need alcohol in our lives); and approaching the upper limit leads to what is politely referred to as “alcohol use disorder”. The latter, if pursued fervently enough, leads to physical problems (like liver damage), behavioral issues (such as depression), and even an early death. In the wine industry, we should care about these things.*

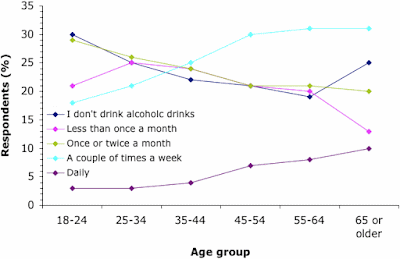
In this regard, we have been told recently that alcohol use is decreasing among recent generations (see the first graph, showing Alcohol consumption frequency in the UK in 2019/2020). Indeed, the so-called Baby Boomers were the most recent cohort of people to widely adopt alcohol consumption as a hobby (as well as a sport, in some cases). What has been less widely reported is that, in many places, the males are decreasing their alcohol consumption faster than are the females, so that alcohol consumption is now greater among the latter group.

Alcohol consumption in the UK by age group

It has long been a truism that alcohol consumption by men exceeds that of women, on average. This is physiological, as much as behavioral. The possession of a womb, used for child-bearing, means that female physiology differs quite dramatically from that of males. You only have to compare hand temperature during cold weather, to know that female blood circulation is quite different from that of males, for example.** So, we have previously expected females to react more strongly than males to alcohol.

A change in consumption bias towards females is therefore a trend of great biological as well as sociological interest. Let's look at some of the data.

We could start with a broad review of the published literature. In the paper on: Birth cohort trends in the global epidemiology of alcohol use and alcohol-related harms in men and women: systematic review and metaregression, 68 published studies are reviewed. The authors' conclusion is that:
Among those born in the early 1900s, males were 2.2 times more likely than females to consume alcohol, 3.0  times more likely to drink alcohol in ways suggestive of problematic use, and 3.6 times more likely to experience alcohol-related harms. [By contrast,] among cohorts born in the late 1900s, males were 1.1 times more likely than females to consume alcohol, 1.2 times more likely to drink alcohol in ways suggestive of problematic use, and 1.3 times more likely to experience alcohol-related harms.

So, the previous 3:1 ratio for risky drinking habits in men versus women is now closer to 1:1, globally. Looking at the paper's graphs, the move towards equality became obvious among people born in the first half of the 1970s (ie. in their late 40s now). This is the cohort known as Generation X. The move to equality was more or less complete among the Millennial cohort. (Generation Z is not included in the review.)

If we now focus on younger people, since they seem to be the relevant group, there are surveys available from the USA (Demographic Subgroup Trends among Adolescents in the Use of Various Licit and Illicit Drugs, 1975-2019), with data collated as tables and figures (2019 National Survey of Drug Use and Health (NSDUH) Releases: Key Substance Use and Mental Health Indicators in the United States).

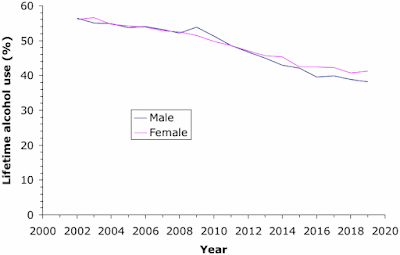
This next graph shows data from that survey concerning the prevalence of reported lifetime alcohol use for both males (blue line) and females (pink line) among people aged 12 to 20. While there has been a continual decline through time in the percentage of people reporting that they have consumed alcohol, in both groups, for the past 10 years females have consistently out-performed the males.

Lifetime alcohol use by young people in the USA

If we now focus on people 17-18 years old (ie 12th graders) converging trends have been observed for measurements involving reported recent drinking (as opposed to lifetime drinking), as reported in: Gender differences in the epidemiology of alcohol use and related harms in the United States. Here is one figure from that paper, illustrating what percentage of 12th graders in each year have reported alcohol consumption.


If we focus on wine alone, rather than all alcohols, we see similar trends for the same age group. The next graph shows the prevalence of reported wine consumption during the 30 days prior to the survey, with the data starting from 1976. Note that the sudden drop in 1988 is probably caused by changing the survey questions to add a separate one about wine coolers (which had become very popular).


Note that, once again, for the past 10 years females have consistently out-performed the males. A similar thing is observed for the prevalence of having 5 or more drinks in a row (ie. getting drunk), as shown in the next graph.


So, through time, fewer and fewer young people are reporting alcohol consumption, but the females have not decreased as much as the males, so that their prevalence is now higher. The data seem to be quite consistent about this pattern among younger generations — this was first reported, as far as I know, back in 2015 (Male and female drinking patterns becoming more alike in the US).

At the risk of sounding facetious, this sort of gender equality is probably not what the Women's Liberation movement originally intended; but it may well be an inevitable consequence of achieving that equality, which must include the bad as well as the good. [Being equal to males is not necessarily to be recommended!]

A recent NPR article summarizes many of the sociological issues associated with drinking parity between the sexes, given that, on average, alcohol affects women more strongly than men (Women now drink as much as men — not so much for pleasure, but to cope). A discussion of the technical literature is available in: Sex differences in stress-related alcohol use.

As has also been reported, US adults have increased their alcohol consumption during the Covid-19 pandemic. As part of this, women have, on average, notably increased their heavy drinking episodes (4 or more drinks within a couple of hours), as discussed in: Changes in adult alcohol use and consequences during the Covid-19 pandemic in the US.


* High Consumption for males has been considered to be 14 "standard drinks" per week, with 9 such drinks for females. Intensive Consumption for males is 5 drinks at any one time, with 4 drinks for females. A Standard Drink is 330 ml of beer, 120 ml of wine, or 40 ml of spirits.

** Females produce all of their eggs at sexual maturity, and then release one every month or so, until they run out. So, they need to protect their ovaries at all times, lest they unintentionally become infertile. In cold weather, their blood circulation preferentially protects their ovaries, at the expense of their hands, toes, ears and nose. Males can produce new sperm at any time, and so they do not need to protect their testes from cold weather, to the same extent. They do, however, need to protect them from violent physical attack!