Monday, May 31, 2021

Australia versus New Zealand wine exports

There has long been a rivalry between Australia and New Zealand. This dates at least back to when Australia was federated, on 1 January 1901. At that time, the New Zealanders were offered the opportunity to become a state of Australia, but inexplicably declined. Since then, the rivalry has continued in sporting events, economics, and politics.

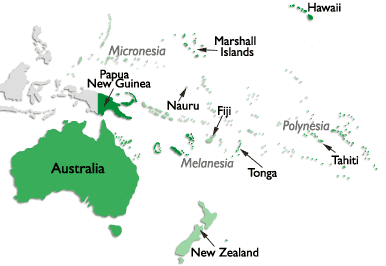
In the latter case, the New Zealanders were responsible for the demise of the ANZUS treaty, by which the Australians and New Zealanders died in large numbers in Vietnam in the 1960s, alongside an even larger number of Americans. Some time later, the New Zealanders decided on an explicit non-nuclear policy, which meant that the Americans lost interest in them, because they could no longer re-stock their nuclear submarines in the South Pacific (see the map below).


New Zealanders have migrated to Australia in large numbers over the decades, including, most famously, John Clarke. However, the NZ Prime Minister who presided over the biggest wave of movement (Robert Muldoon) noted: "New Zealanders who emigrate to Australia raise the IQ of both countries." Smart alec. So, Australia usually wins any trans-Tasman sporting event (eg. cricket), except for Rugby Union, in which the New Zealanders are damned hard to beat, by anyone. Also, Australia did not have Footrot Flats.; they did, however, win the America's Cup 12 years before the New Zealanders.

All of this means, of course, that a comparison of Australian and New Zealand wines is of great importance, particularly with regard to wine exports.

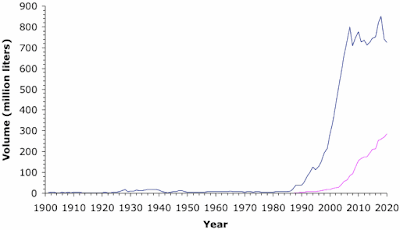
So, let's start with the volume of wine exported. The data, as usual, come from the Annual Database of Global Wine Markets, compiled by Anderson, Nelgen and Pinilla (Tables T10 and T21), along with recent data from Wine Australia and Rabobank. The first graph shows the wine volume (vertically) exported from Australia (blue line) and New Zealand (pink line) since 1900.

Volume of Aust and NZ wine exports

As you can see, there was an exponential increase in the Australian exports from 1980, until a peak c. 15 years ago; since then, the average has stayed roughly the same (c. 700–800 million liters annually). For New Zealand, on the other hand, there was effectively no export before 1960, and very little before 1990, with an exponential increase from 1980 to 2010, and a more steady increase since then.

Now, Australia and New Zealand differ dramatically in size, and therefore in vineyard area, so that we would expect a difference in wine production, and thus export volume. Currently, Australia has c. 3.5 times as much vineyard area as New Zealand, and produces c. 4 times as much wine (New Zealand produces just 1.2% of global wine production). So, this mostly explains why Australia exports c. 2.5 times as much wine.

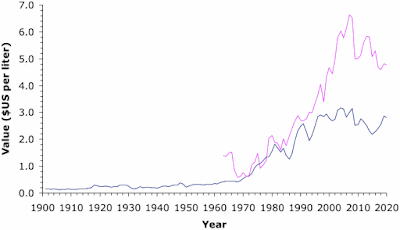
However, the difference in volume is interesting, since obviously New Zealand exports a greater percentage of its wine production (90%) compared to Australia (65%) (Which countries export most of their wine production?). Even more telling, though, is the price paid for that exported wine. This is shown in the next graph, which illustrates the value (in $US per liter) of the exported portion of the two wine productions. Note: there are no export price data for New Zealand (pink line) prior to 1963.

Value of Aust and NZ wine exports

Clearly, there was not a lot of difference in value prior to 1990, but this difference increased rapidly over the subsequent 10 years, in favor of the New Zealanders, settling at a value about twice that of Australia over the past 10 years. This is sad.

The issue here, of course, is that Australia will export just about anything, no matter the price, and has thereby become a major exporter of bulk wine (Australian bulk wine exports are economically inefficient). This generates a great volume but not necessarily great value. People have heard of Yellow Tail and Penfolds, and not much else from Australia (and the less said currently about Treasury Wine Estates, the owners of Penfolds, the better). However, it must be remembered that Australia developed the bag-in-a-box concept way back in 1965 / 1970; which, unfortunately shows you just how far back mass-produced wine has been of prime interest.

On the other hand, New Zealand wine exports recently hit NZ$ 2 billion. This has been based on a premium image for the international reputation; and NZ wine apparently remains either the highest or second highest priced wine category in the USA, United Kingdom, Canada, and China (its biggest export markets are the USA, the UK, and Australia).

Mind you, it is sometimes characterized as a bit of a one-trick pony, being best known for its Marlborough Sauvignon blanc (Is Marlborough really the Sauvignon blanc capital of the world?), and more recently its Pinot noir from Marlborough, Martinborough and Central Otago. (I can also recommend their Riesling, Chardonnay and Pinot gris.) It has also been noted that the recent boost in exports appears to be largely driven by an increase in bulk wine sales, although bottled wine has hardly dropped, while both bulk and bottled wine have risen in value per liter.

South Pacific

For Australia, exports have hit a rocky patch, of course, Until recently, its top markets in terms of value have been China, the UK, and the USA. The first of these has tanked in recent months (Where China get its wine, these days). Actually, China is also New Zealand’s top trading partner — China is New Zealand’s largest market for exports and the second-largest source for imports. This has caused recent concern (Exposure to Chinese market turns New Zealand heads to Europe).

Perhaps the biggest current export problem for Australia, in terms of value, is not China, but the USA, as discussed in: A US mystery: Australia. This notes that, unfortunately:
  1. cheap Yellow Tail became the face of Australian wine in the USA
  2. Australia has not done a good job of educating the US about its wines, or encouraging the idea that they are worth premium price-points (eg. We shouldn’t be talking about Australian Cabernet anymore)
  3. there isn’t much knowledge in Australia of how the US market works, and thereby pricing wines appropriately for the three-tier system.
These issues should be addressed, along with finding replacements for the disappeared Chinese market.

Finally, I will note that I can still get New Zealand lamb in the supermarkets here in Sweden, but I can no longer get Australian beef (it has been substituted by Canadian beef, it seems). This seems wrong, somehow. Besides, lamb may yet unite the two countries, in an unexpected way (see the video for Australian Lamb’s 2019 Australia Day advertisement).

Monday, May 24, 2021

Is big data always needed in the wine industry?

We all know that there are plenty of things that a person can do easily but machines find more challenging. For example, when the police are directing traffic they often pick gaps between groups of cars to be the "stop" points, whereas arranging this behavior using traffic lights is much more complicated. We have all driven along a main road and been stopped at every single [expletive deleted] light, haven't we? (If you haven't, then just you wait ... your time will come.)

Well the same thing applies when looking at or using data, whether in academia or in industry. Sometimes, the analysis is way too complicated for the simple outcome, which anyone could easily have worked out for themselves, unaided.

Jon Carter — www.cartertoons.com

Given my advanced age, obviously data analysis has changed a lot during my professional career, not least because computers became prevalent (yes, I just manage to pre-date personal computers), and their computational power began to be appreciated. So, a lot of new-fangled computational ideas were developed during my life-time, some of which I learned about, and used. One or two of them have appeared in this blog, as I have applied them to wine-industry data (eg. The study of grape-vine leaves is harder than you might think).

However, there are others that seemed to me to border on nonsense, in the sense that they applied very complicated mathematical ideas in ways that seemed to produce little of practical value. Looking at data analysis in the wine industry leads me to a similar feeling. So, I thought that I might mention it here.

Classic data analysis

Many of these analyses involve the use of what is called Big Data. We have all encountered small datasets, where someone does a survey of some sort, and we then wonder whether the results are worthwhile, because the sampling of people looks a bit restricted. The idea of collecting massive datasets is supposed to be to circumvent this issue. I therefore have nothing against big datasets, because they can be useful for many things. For example, Netflix uses this for its recommendation engine (see Netflix amped up recommendations with its own big data. What that means for wine), which seems to work quite well. YouTube, on the other hand, simply recommends the same videos to me over and over again, irrespective of whether I have already viewed them — they might like to check out what Netflix is doing.

However, Big Data for its own sake is not necessarily useful.

This comment was occasioned by a recent research paper:
Wineinformatics: Using the full power of the Computational Wine Wheel to understand 21st century Bordeaux wines from the reviews. Beverages 7: 3 (2021).
I am not criticizing this particular piece of research, on its own. To me, it is simply a classic example of doing something a bit odd — applying complex mathematical techniques to something that a human can do in a few seconds. This may be computationally interesting, but it has little practical value for the rest of us.

In this case, the objective is to get the computer to break down written wine reviews into their component parts: there 985 binary wine characteristics and 34 continuous characteristics, which are used to describe 14,349 wines. That is, the words become numbers, and can thus be processed mathematically. The claimed usefulness is "to build a model for wine grade category prediction".

Now, no-one is going to admit that they can write a professional wine note in 20 seconds, but every professional can work out what they are going to say about any given wine in pretty short order. Why do we need a big-data computer analysis, with a Naïve Bayes classification algorithm and a Supported Vector Machine to build a model for this? I guess we will find out, eventually.

Support Vector Machine structure

Mind you, humans themselves do not necessarily communicate well, even when using words; so there may well be something in the idea of reducing those words to numbers.

Take the recent example propounded by Jane Coaston (We need to have a national conversation about wine descriptions) and Esther Mobley (Can Pinot Grigio 'express' a concept? Here's why wine language drives me nuts).

The reported fuss is about this particular sentence:
“Lagaria wines express varietal character and terroir within a classic and modern concept.”
Various theories are proposed about how this allegedly strange sentence arose. It seems to me that the simplest explanation is that these two readers are not reading it right. It does not say "Pinot Grigio express a concept". It says that all things exist within some concept (as they must do), and that Pinot Grigio expresses its character within a modern one (as opposed to, say, an old-fashioned one). So, Pinot Grigio expresses varietal character — it does not express a concept. This seems to be a quite straightforward thing to say.

The problem is: if human beings can get so tied in knots with language, how are we ever going to train a computer to make sense of it?

Monday, May 17, 2021

Where China get its wine, these days

Last week I looked at the declining wine market in China (So, why has China gone off the boil?). This week, I thought that I might look at where China gets its wine — has that changed recently, as well?

In one sense, China is no different to other Asian countries, in that wine is increasing in the mix of alcohol beverages, and beverage production has not kept up with the increase in demand, so that imports are needed to fill the gap (Asia’s emergence in global beverage markets: the rise of wine).


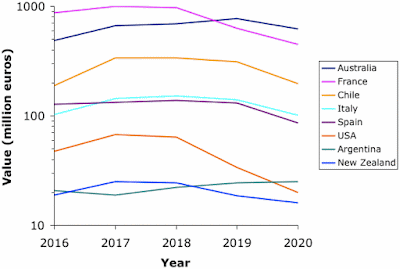
Bottled wines dominate China’s imports, making up more than 90% of the value each year; so, we are talking about a fine-wine market. As such, we would expect the wines to be sourced from well-known fine-wine regions, from around the globe. The first graph shows the top eight importers by value, for the past five years. [The data were compiled from various online reports, but the origin in all cases was from the Chinese Custom's Office.]

Note that the vertical scale is logarithmic, so that we can clearly see the lower-ranked countries. These have been followed by Germany, Portugal, and South Africa, in various orders depending on the year.

Origin of wine imported into China 2016-2020

Note, first, that there has been a general decline in the value of imported wine since 2018, as discussed in my previous post (due, for example, to the slowing of the local economy). This has affected all of the importing countries except Argentina. This may indicate an increasing interest in Malbec wines, and seems to bear out earlier hopes (Can China ‘save’ Argentina’s wine industry?).

The USA has had a rapid decline since 2018, presumably due to the ongoing trade war with China (US wines latest victim of trade war with China’s 93 percent tax). Naturally, there are moves afoot to try to change this (Feinstein, Padilla ask Biden admin to get China to lift tariffs on U.S. wines).

France has also had a rapid decline since 2018, having been the top importer until then, in both value and volume. The French wine was apparently being replaced by wine from Australia, which showed a steady increase until 2019, when Australia became the top importer. Since then, the trade war with Australia has decimated wine imports, which in 2021 have been very little from that country (see the graph in: Wine exports fall four percent to $2.77 billion). The Australians are not taking this lying down, of course (Australia is taking China to the World Trade Organisation over its intensifying trade war), and the USA has pledged to help (US Secretary of State says Australia will not be left alone to face China coercion). In the meantime, France has now returned to number one in 2021 (France leapfrogs Australia to become top wine supplier to China), although Chile, Spain, Italy, and the USA are all expected to benefit, as well (How will markets adjust to China’s new tariffs on imports of Australian wine?).

It is worth noting that Spain and Italy, the other two European nations on the list, have run pretty much neck-and-neck, a long way behind France. China has apparently been Spain's fifth largest wine market (Spanish wine in China), while it has been somewhat less important to Italy — 14th by volume and 13th by value (Italian wine exports by destination).

Also, Chile, the other South American country, has consistently been ranked third in imports, a long way behind France and Australia, although China has been its biggest export market since 2016 (China's flourishing wine market becomes top export market for Chilean vineyards). It is poised to replace Australia on the list if things continue the way they are going this year (Why Chinese tipplers like Chilean wine).

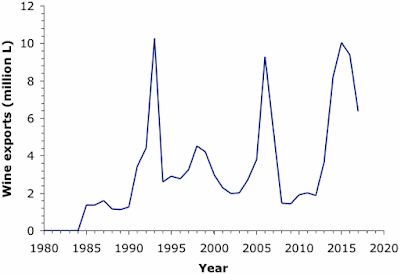
Volume of wine exports from China over the years

Finally, it may be worth taking a quick look at wine exports from China, as shown in the second graph, for export volume since the 1980s. Domestic wine consumption relates to imports net of exports, of course.

You may make of this what you will. I have not seen any discussion of the three distinct peaks of wine exports (1993, 2006, and 2014–2016). Meanwhile, the wine export quality has been reported to be variable (Chinese wine — ready to export?).

Monday, May 10, 2021

So, why has China gone off the boil?

There have been several reports over the past few years about the declining wine market in China. Indeed, wine production in China is currently listed as the 6th fastest declining industry in that country (Fastest declining industries in China by revenue growth (%) in 2021). So, it seems worthwhile to gather in one place some pictures of the situation, given that China has been the second largest wine market in the world (The wine market in China).

We can start with a look at the simple economics in recent years. Here is a graph of the estimated market size (in USD) over the past few years, from the IBISWorld industry statistics:


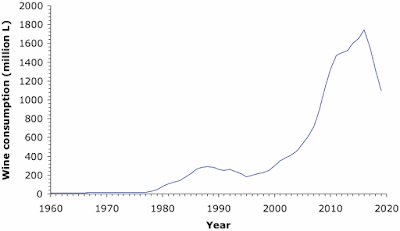
The decrease over the past few years is obvious. This decrease is reflected clearly in estimated wine consumption, as shown in the next graph, which goes all the way back to 1960. (This and all subsequent graphs are from the Annual Database of Global Wine Markets, compiled by Anderson, Nelgen and Pinilla, supplemented by the OIV's State of the World Vitivinicultural Sector In 2020.)

Wine consumption in China 1960-2020

The decrease in consumption dates from 2016, and is continuing rapidly as I write. Note that this timing pre-dates by 3 years the decrease in market size illustrated above, which suggests an interesting incongruity.

Moreover, there is no equivalent decrease in the Chinese area under vine, which is shown in the next graph. This has plateaued recently, but not decreased.


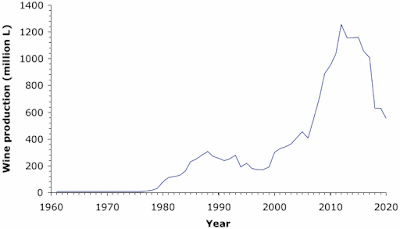
On the other hand, there has been a dramatic decrease in wine production, despite the stable vineyard area, as shown in the next graph. Interestingly, the decrease in production started in 2012, 4 years before the decrease in consumption. Is this prescience?

Wine production in China 1960-2020

Clearly, these patterns cannot be reconciled in too many ways. It has been argued that production is being decreased to match decreasing consumption (even though it pre-dates the decrease in consumption), while the vines themselves are either not being grubbed out or their reduction is not being recorded. The reduction in Chinese production could, of course, be a shift from quantity to quality — bulk wines being replaced by fine wines (Fine wine and caviar — made in China?).

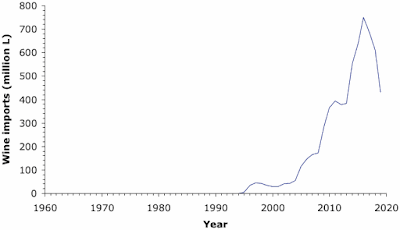
It has also been suggested that China’s wine production has been dropping due to competition from imported wines, but this cannot be so. In fact, there has been a dramatic recent decrease in imports, which matches decreasing consumption, since it also starts in 2016, as shown in the next graph. Note that imports were effectively zero before 1995. Clearly, it is not just domestic wine that is going off the boil, but the foreign stuff, as well.

Wine imports to China 1960-2020

So, it is the decreasing production that is anomalous. The decrease starts before the decrease in consumption, and is not matched by any decrease in vine area. So, what is going on? It has been noted that an economic slowdown has been occurring in China, and there has been a trade war with the USA, and now also with Australia. Also, wine may well be finally losing the cachet that it started to acquire among Chinese consumers after the Cultural Revolution, back in the 1970s, and which accelerated in the 1990s. A 2014 even that might explain some of the observations is the Chinese government's official crackdown on business / political graft in 2014, which curtailed formal gift-giving (For liquor makers, cheer dries up in China).

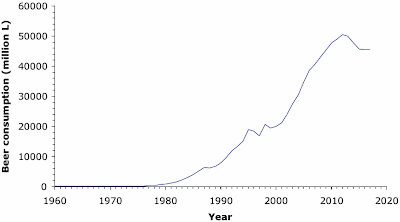
Finally, by way of contrast, it is worth noting that Chinese beer consumption has plateaued recently, but not decreased, as shown in the final graph. Note that beer consumption increased at the same time as wine, but greatly exceeds wine consumption by a factor of 30. A beer market, clearly, not a wine market.

Beer consumption in China 1960-2020

An interesting alcohol market, obviously. So, why is the Australian wine industry concerned about losing the Chinese market (China ‘indefinitely suspends’ economic talks with Australia)? It is declining, anyway; and any forecasts from the graphs above do not promise that it will remain a major market for too much longer.

Thanks to Bob Henry for some of the above suggestions.

Monday, May 3, 2021

Changes in scores of top wines?

There have been many comments about wine critics, especially concerning various characteristics of their wine ratings, including things like inflation and inconsistency. One thing that I could look at here is the matter of "top-rated" wines, and how their scores vary from year to year.

In this regard, James Suckling provides an annual list of Top 100 Wines, which is worth looking into; so, I have collated the scores for the years 2014 to 2020, inclusive. [Thanks to James for giving me access to his database.]


Note that in this post I am not concerned with which particular wines make it onto the List each year, but merely with the range of the scores of those wines that got onto each list. Also, note that the wine scores themselves are not the sole criterion for being on the Top 100 List — a score of 100 does not necessarily get you to the top of the list, for example.

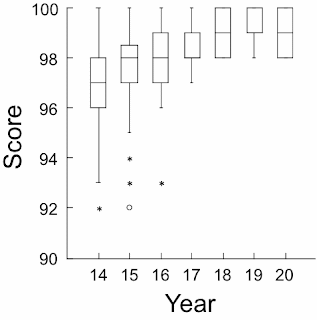
The results are shown in the graph, as a series of box-plots, one for each year. In this graph, the collection of 100 scores is summarized vertically for each year.

Wikipedia has a detailed explanation of what a box-plot is, for those of you who are interested; and there is an explanatory diagram at the bottom of this post. Basically, the middle [horizontal] line is the median — 50% of the scores are above this line and 50% are below. The central box encloses the middle 50% of the scores, while the vertical lines (known as whiskers) show the range of the upper and lower 25%. Any "outlying" values are shown separately as dots.

Scores of James Suckling's Top 100 Wines

In our case of the wine scores, there is a distinct pattern through time. The scores converge upwards to an average value of 99, and they have stayed there for the past few years. This is not unexpected, as the years 2015 and 2016 were difficult ones. Indeed, the 2015 Top 100 Wines list does not actually show the wine scores on the web page (although they are available in the database), but focuses instead on the wines themselves; and the 2016 Top 100 list is no longer displayed on the web site at all.

So, the past four years have been relatively consistent. The top wines mostly scored 98—100 points, whereas in earlier years they (occasionally) went down to 92. The median score has recently been 99, but was 98 in 2017. So, the past few years have been consistently good, vinously speaking, or perhaps James Suckling is suffering from score inflation. I suspect that the former explanation is the correct one, because the top wines in any given year should score at the top of the range, irrespective of what wines they are or where they come from, or the preferences of the critic.