John is a brand consultant, former VP of marketing at The Wine Group, Director of DTC for Allegretto Winery, and the author of How to Hack a Wine Tasting.
The Wine Gourd recently referenced the key reasons for not drinking beverage alcohol as being: religious, political, social, and health (Which people do not drink alcohol?). However, at least four other variables lower the likelihood of personal alcohol consumption, and especially wine:
- The increasing percentage of adults with the genetic propensity for bitterness sensitivity,
- The lack of brand equity in the wine category,
- The lack of income for the cost of wine, and
- The coming shortage of ten million adults in places like the U.S.A.
The percentage of adults with a genetic propensity for bitterness sensitivity is expected to double in the next decade. The recent SVB Wine Report pointed out: “A member of the millennial generation is twice as likely to be a non-white minority. While only 28 percent of the boomer population is non-white, 45 percent of the millennial population — and almost half of Gen Z — is non-white.” Increasingly the U.S. population is made up of non-white minorities from areas genetically predisposed to bitterness sensitivity. In some areas of the world, eighty-five percent of the native peoples are sensitive to bitterness. In other areas, it is only five percent.
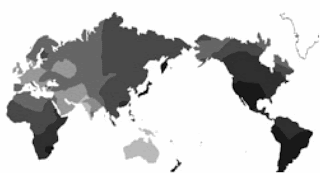
The "Geography of Taste" map (see below) was created by Dr Utermohlen M.D. at Cornell as part of her research. The areas with the highest percentage of native populations genetically predisposed to bitterness sensitivity include Southern Africa, most of Asia, and parts of Latin and South America. The percentage of the U.S. adult population of these non-white minorities is increasing. The people with the lowest prevalence of bitterness sensitivity are declining as a percentage of the adult population. They tend to be genetically from Europe and the Middle East. Humans who are sensitive to bitterness are less likely to drink any beverage alcohol, because alcohol is bitter. Their tendencies will be toward not drinking, or consuming sweeter beverage alcohol, because sugar masks bitterness (Bitter masking by sucrose among children and adults).
There has been an online nature vs. nurture debate, concerning whether your genetic predispositions matter in adult wine acceptance and preference, featuring Jamie Goode, Ph.D. (plant biology) and Tim Hanni, MW. I call this the “Don't look up” vs. “Ignore at your own peril” of wine thought leadership. I agree with W.E. Deming:” In god, we trust — all others bring data.” Tim’s side has the data.
Moving on to point 2, a brand is a story in which you can find yourself. What is wine’s story? What is the story of wine, and how often has the wine category told its story? Neither the wine category nor any leading wine company has invested in brand marketing over the past forty years in the same strategic, consistent, brand equity-building manner as have those in the beer and spirits categories. Just ask most wine consumers whether they can remember an advertisement for wine. Interbrand’s 2022 list of the top 100 brands worldwide includes Budweiser, Corona, Heineken, Jack Daniels and Hennessy, but no wine brands.
Wine is not winning the beverage alcohol contest for the next generation’s “share of stomach”, because individually and as a category wine brands have done and still do little to grow the “Share of mind” for brand wine among any consumer groups (Building equity for the U.S. wine brand).
In a 2015 study by a University of Texas researchers found that spending on advertising can be related to consumers’ choice of brands or categories of alcoholic beverages, but not consumption (Beer, Wine or Spirits? Advertising’s impacts on four decades of category sales). The study analyzed the total expenditure by the beer, wine, and spirits industries on “measured media” from 1971 to 2011, a period of 40 years. Measured media included: print, outdoor, network TV, spot TV, cable TV, syndicated TV, network radio, spot radio, internet, Spanish TV, and FSI coupons. During this period, the beer category invested more than $27 billion on measured media — 6.5 times more than the wine category. Spirits invested over $10 billion — 2.5 times more than the wine category.
This five-decade-long lack of investment in building brand equity, combined with a category brand “tone of voice” that is exclusive, not inclusive, creates an even lower share of voice. Share of voice, modified by the tone of voice, equals the share of mind, which equals the share of the market over time.
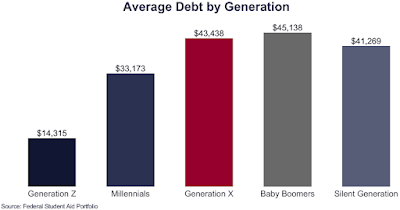
Moving on to point 3, the young adult population of the USA is saddled with $1.63 trillion in student debt, stagnated wages, and the highest percentage of adult children living at home in seventy-five years (A majority of young adults in the U.S. live with their parents for the first time since the Great Depression). The majority of federal student debt is concentrated with Generation X. The average Baby Boomer with student loans tends to owe more than the average Millennial, although Millennials have a larger overall debt than do Baby Boomers (see the graph above). Generation Z held 6.4% of the total $1.57 trillion student loan debt. Millennials held 30.4% of the total debt. Generation X held most of the debt at 38.8% (Student loan debt by generation).
When you exclude the idea that a serving of wine purchased at retail in a bag-in-the-box package costs less per ounce of ethanol than does a serving of beer or spirits, wine is far more expensive than these other beverages. Premiumization costs far more in the wine category than it does in beer or spirits. Jon Moramarco, managing partner of bw166 LLC, reported (see the SVB wine report) that, on average, the cost per serving of wine is $2.15 per 5 oz. glass, $1.28 per 12 oz. bottle of beer and 93 cents for a 1 oz. shot of spirits. This cost disadvantage is evident in the “on-premise” category.
Finally, for point 4, according to U.S. census data, in 2022 there were four hundred thousand fewer Gen Z entering the adult workforce than the number of Baby Boomers retiring (see the graph above). Gen Z is the smallest generation, even smaller than Gen X. That deficit doubles to over eight hundred thousand per year, culminating in a shortage of ten million adults by the end of the decade. Peter Zeihan, geopolitical analyst provides a concise description of the issue.
So, in addition to the religious, political, social, and health reasons for not consuming wine, there will be ten million fewer potential wine consumers in the U.S. than during the reign of the Baby Boomers, regardless of their genetically determined sensitivity to bitterness, incomes, or brand preferences.
* From David:
I have been in another town, doing a tasting of some 2005 red Bordeaux wines. Very nice! I am therefore grateful to John Stallcup for providing this week’s guest post.


Great post, thank you for bringing up these additional points and linking to the Goode blog post, very interesting reading. However, I don't think the comparison of beers, sprits, and wine via 'measured media' is a fair comparison. Wine companies have invested heavily in bringing their product direct to consumers, more so then any other alcoholic beverage category, and it is just another channel for brand building. Costs for running tasting rooms & even e-commerce should have been considered paid media and used in the research paper's comparisons. Spirits and beer companies are doing the tasting room model right now because of its high conversion rates, but it is also because it is a great branding tool. Without adding that awareness platform into the calculation it is like comparing apples to oranges, or maybe grapes to barley.
ReplyDeleteThe concept of a specialized tasting room is not unique to the wine industry, but it is certainly a major consideration when comparing different parts of the alcohol industry. Its expense should, of course, be taken into account.
Delete