I have written before about the relationship between how much wine people drink and how much they actually pay for it (The cost of wine consumed differs greatly between countries); and I will return to that topic again soon. However, before then, I will look at one particular country: the United States of America.
What I will do here is look at the relationship between per capita wine consumption versus per capita expenditure on wine, throughout this century. As a quick preview, Americans have consistently increased both their consumption and their expenditure, per person, through time.
The data that I have used come from the Annual Database of National Beverage Consumption Volumes and Expenditures, 1950 to 2015, by A.J. Holmes and K. Anderson (Wine Economics Research Centre, University of Adelaide, July 2017). Tables 1.17 (Wine consumption per capita, in liters of alcohol) and 1.22 (Wine expenditure per capita, in $US) contain the information that we need.
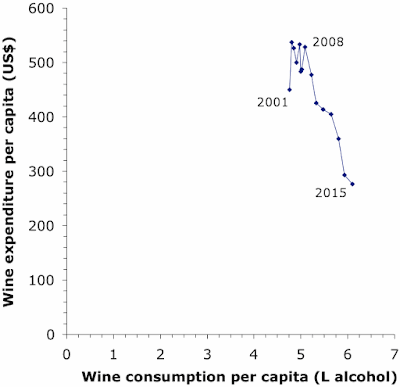
The result for the United States is shown in the first graph, for the years 2001 to 2015. Each point represents one year, located vertically based on the amount of money (in $US) spent on wine during that year per person, and horizontally based on the liters of alcohol consumed as wine per person. Several of the years are labeled.
The main pattern in the data is clear — Americans, on average, increased their wine consumption and expenditure pretty much by the same amount every year. Does this surprise you? (Remember: this is per person, not the total for the whole country — the wine-drinking population has grown, but this has no effect in the graph.) Interestingly, the consumption and expenditure increase together — Americans are not “drinking better” now compared to earlier, but are still spending roughly the same amount per bottle as they were before (they are just drinking more bottles).
There was only one exception to this pattern: the year 2009 involved a drop in expenditure but not volume, followed by a return to the same increase the next year. Most of you will remember (not fondly) the Global Financial Crisis of 2007—2008. This was reported as the most serious financial crisis since the Great Depression (1929). Instead of taking to drink, Americans (and many others) cut back on their drink expenditure but not volume. However, they apparently recovered pretty quickly, compared to the situation a century earlier.
Lest you think that increasing wine consumption per person is inevitable in the modern world, we could look at a comparison country, to see what happened there. An obvious comparison would be one from the Old World, with its long tradition of wine consumption, so why not pick France? This next graph shows exactly the same information as above, but this time for the French people, up until 2015.
As you can see, things are quite different. Note, first, the dramatically different scales for the two graphs — French consumption and expenditure both greatly exceed those of Americans. The USA has a long way to go!
Furthermore, there was uncertainty in consumption for the first 8—9 years of the century, but it has been all downhill since then. The GFC obviously had an effect in 2007 and 2008; but it is almost like the French then gave up at that stage, and started to drop the idea of drinking quite so much wine, altogether. Once again, the volume and expenditure dropped together, so that the people drank the same quality of wine, just less of it.
It is certainly a pity that the available data end in 2015. It would be interesting to see how the patterns have continued in recent years. For example, we are told that: U.S. wine sales have been in a slump in recent years, with a 5.2% decrease in overall wine sales year over year (according to Nielsen IQ). In particular, it has been reported that currently: Consumers choose to drink less to save more (a key economizing strategy for rising inflation). However, we are also told that Premiumisation continues, implying that more is being spent per bottle, but with fewer bottles.
Similarly, in France wine consumption has continued to decline. In 2020, the national consumption was only three-quarters of what it had been in 2007 (Statista). Apparently, wine is now seen as a more occasional indulgence, rather than a daily necessity (Why are the French drinking less wine?). The younger generation may well think that they drink less but better, if their expenditure has not decreased as much as the volume.


Is per capita wine expenditure nominal or real? If nominal, it would be helpful to convert to real using the CPIs.
ReplyDeleteAccording to the original database, the expenditure calculation incorporates the CPI.
ReplyDelete