I have written before about the balances between wine imports and exports for different nations (Where does all of this wine come from and go to?). In that case I looked at volume, whereas this time I will look at the monetary value, specifically of bottled wine.
Obviously, the difference between volume and value is the price per bottle (or box). Some countries habitually deal with cheap wines, while others are more up-market (eg. The USA imports more expensive wines than anywhere else).
The data come from Comtrade, the United Nations International Trade Statistics Database. I accessed all of the data available for 2020 in the category: "Wine; still, in containers holding 2 litres or less" (code 220421). So, we are dealing with bottled wine, rather than bulk wine — bulk exports are bottled in the receiving country, and sometimes also mixed with the local produce. Also, the data exclude sparkling or fortified wines.
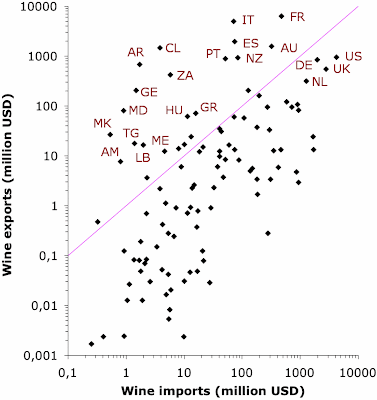
I have plotted the results in the first graph, which shows the total reported imports (in millions of $US) horizontally, and the total reported exports vertically, with each point representing a single country (as recognized by the UN). Note that both axes have logarithmic scales, so that the most active countries are dealing with up to 4 billion dollars of wine annually.
The pink line indicates a perfect balance between imports and exports. For those countries above the line, their exports exceed their imports, while for those below the line, imports exceed exports. Obviously, most countries are net importers of wine — only two dozen countries are net exporters of bottled wine.
In the next version of the graph, most of these exporter countries are labeled with their 2-letter codes, along with four other countries. There are six unlabeled countries only just above the line, which are (from left to right): Uzbekistan, Azerbaijan, Slovenia, Uruguay, Bulgaria, and Austria. So, for example, Uzbekistan does not export much bottled wine, but it imports even less — it is the second smallest importer by value (only Niger imports less).
France (FR) and Italy (IT) are the clear export leaders for bottled wine, followed by Spain (ES), which is the biggest exporter of bulk wine. Then come Australia (AU), and Chile (CL), followed by Portugal (PT), New Zealand (NZ), and Argentina (AR). Next are South Africa (ZA) and Georgia (for the latter, see: How much does wine contribute to total exports?).
Of these countries, Chile, Argentina, South Africa, and Georgia are not big importers of bottled wine, unlike the other labeled countries — the locals clearly rely on their local wines, for sustenance.
Both the USA and Germany (DE) have big wine production, but they still export less bottled wine than they import.* The United Kingdom (UK) and the Netherlands (NL) are not big wine producers, at all, and they thus import a lot of bottled wine. However, they both re-export a fair bit of it, to other places in Europe — for example, a lot of Australian wine comes into Europe via the UK. So, technically, they are pretty big exporters.
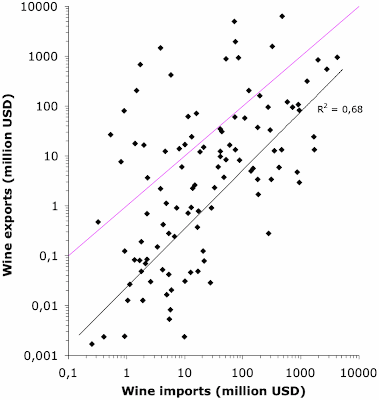
Finally, the third graph simply looks at the relationship between imports and exports for those countries where exports < imports. The black line is the regression line of best fit. The joint relationship between imports and exports encompasses 68% of the between-country variation in the data. It is not surprising that there is a simple (power) relationship between imports and exports, which will be based mostly on population size (more people means more of both imports and exports).
* The composition of US wine import values by country is detailed here.


No comments:
Post a Comment