As I explained in a much earlier post, I base my own wine purchases mainly on value for money. That is, I do not buy the highest-scoring wines, nor do I purchase the most-expensive (or cheapest) wines. Instead, I buy the wines that seem to offer the biggest bang for my buck — this combines the scores and the expenses into a single number (Choosing value-for-money wines).
Therefore, it always seems odd to me when I read reports that talk about individual broad-scale wine-industry characteristics (such as cost and volume), without ever comparing them with each other. The concept of value-for-money, for example, extends well beyond the relatively simple idea of a wine drinker buying individual wines.
A recent case in point comes from the World Bulk Wine Exhibition: Dissimilar performances among the world’s leading bulk wine exporting countries.
That online article is about the top bulk wine exporters for January—May 2023, and lists the top 15 bulk-wine exporting countries based on value (million euros, €) and volume (million hectoliters, hl). However, to my mind, neither of these characteristics on their own tells us how well the various countries are doing. For example, it is no use selling lots of wine if you have to sell it very cheap.
We can see this clearly, in this case, by the simple procedure of plotting a single graph showing both numbers for each country. I have done this in the graph below. Each point represents one of the 15 countries, with value plotted horizontally and volume vertically. The straight line is the linear regression, which indicates the average form of the relationship between the two sets of numbers.
I have labeled four of the countries, to illustrate value for money. The two countries above the line are doing very poorly (lots of volume but nor much value), and the two countries below the line are doing very well (less volume but lots of value).
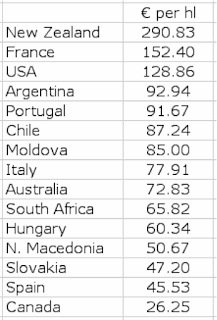
To make this clear in a table (or list), the thing to do is calculate the value for money, calculated as: € per hl. I have done this in the following table. This makes it obvious that New Zealand is doing twice as well as the second-ranked country (France), and two-and-a-quarter times as well as the USA. Similarly, Canada is doing very poorly, while Spain, Slovakia and North Macedonia are doing twice as well, but are still not doing really well.
The concept of value for money is an important one; and I do wish that more of the people who present data for the wine industry would take it into account, when preparing their data presentations. In the meantime, you could do a lot worse than check out this year’s Bulk Wine Exhibition.
As a final point, it is also important to emphasize, as Robert Joseph has done recently, that value-for-money is often enforced by circumstances rather than being chosen by the producer. Spain’s poor showing above, for example, is quite likely to be enforced by their current over-production of cheap wine compared to demand. In this sense, it is perhaps fortunate that we are apparently now seeing the Smallest Spanish harvest ever recorded, with the steepest losses being seen in the hottest cultivation areas — reduced volume might restore the value-for-money.


No comments:
Post a Comment