Monday, April 29, 2019

How can you doubt global warming?

Every time we look at the viticulture news these days there is something about the current problems with grape harvests, whether it be drought, flood, or fire. These are all the result of climatic effects, and are therefore attributed to climate change.

Climate change is a big issue for all parts of the agriculture industry, not just grape-growing, because of the industry's almost complete reliance on the weather, which determines both the timing and the size of each harvest. Climate change thus leads inevitably to agriculture change. At the moment, the changes seem to consist of an increase in variability from year to year, from boom to bust. This is no way to try to make a living.

NASA forecasts of how global temperatures might change.

Global warming first became a big news story in 1988, which had the then hottest northern-hemisphere summer on record, with widespread droughts, and with fires from the Amazon rain forest to Yellowstone National Park. It is now 30 years since that time, and there are still climate-change skeptics running around, notably in Australia and the USA.

It is thus important to note that there are three separate issues related to the current concern about global climate change:
  • evidence that temperatures have increased recently
  • ideas about what might be causing this increase
  • and what, if anything, we might do about it.

The first of these issues seems to be unproblematic — every country on Earth has a Bureau of Meteorology of some sort, and as far as I know they have all been recording a slow but steady increase in world temperatures for at least 5 decades now. Furthermore, as discussed below, we have temperature records that go back 6 centuries that show the current temperatures to be unprecedented during that time.

The second point may be slightly more problematic, although the consensus is that the cause is increased carbon dioxide (CO2) in the atmosphere. Many people do not know that the idea that our climatic temperatures are determined by atmospheric gases actually dates back a century, now. So, I will look briefly at the history in the next section.

I guess that it is the third point that is the problematic one for the skeptics. They ask: "why should we do anything?" To me, the answer lies on our formal taxonomic name, Homo sapiens, which is Latin for "thinking person". Not only can I learn to use a screw-driver, which most other species cannot, I can think about my effect on the world, and about what sort of world I would like to live in. Maybe, just maybe, it is our effect on the world that is causing the sort of world we currently live in.

Atmospheric carbon

It was back in the 1820s that Joseph Fourier realized that some of sunlight's energy must be held within the atmosphere, helping to keep the Earth warm. It was thus apparently he who first concluded that Earth’s air layer acts like a greenhouse — energy enters through the transparent "walls" and is then trapped inside. It was 40 years later that John Tyndall tried to work out what kinds of atmospheric gases were most likely to play a role in absorbing sunlight, and demonstrated that CO2 is the principal culprit.


It was not until the 1890s that Svante Arrhenius started to wonder how much CO2 decrease was required to explain the Earth's cooling during past ice ages (as was apparent in the geological and fossil record), and what would be the effect of similar CO2 increases. It is ironic that he wrote:
By the influence of the increasing percentage of carbonic acid [CO2] in the atmosphere, we may hope to enjoy ages with more equable and better climates, especially as regards the colder regions of the Earth.
In the 1930s, Guy Stewart Callendar first noted that both the United States and the North Atlantic region had warmed significantly, on the heels of the Industrial Revolution. Sadly, this observed effect was then counter-balanced by the subsequent 30 years of global cooling, now attributed to aerosol pollutants blocking the entry of sunlight. So, it was thus not until the 1970s that the start of the current long steady increase in global temperatures became clearly evident in the world's many meteorological records.

Long-term temperature records

The problem with "long-term" records is that we haven't been accurately measuring anything for all that long, in the big scheme of things. Take, for example, our records of the amount of CO2 in the atmosphere, as shown in the first graph.


The Scripps Institute of Oceanology did not set up the Mauna Loa Observatory (on a mountain in Hawaii) until 1958, which is our main source of instrumental measurements of global carbon dioxide. So, we have to use indirect measure of atmospheric CO2 before that time, as in the graph. This makes it a bit tricky to show that CO2 has increased since the Industrial Revolution, which is a key part of connecting global warming to atmospheric gases.

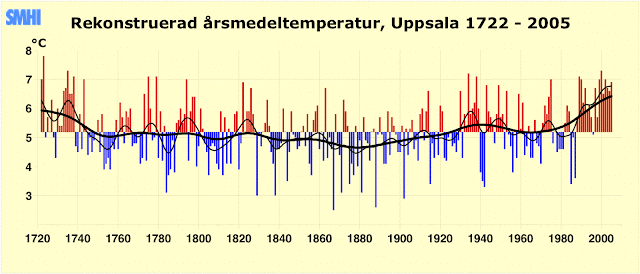
Temperature, on the other hand is a bit easier to measure. Many of you will know that the international scale for measuring temperature is named after Anders Celsius (not that other scale, named after Daniel Fahrenheit, and now used by only a few countries). Celsius was professor of astronomy at Uppsala University, in Sweden, and so it should come as no surprise that the longest daily temperature record in the world is from the city of Uppsala.

Mind you, even that is not as simple as it seems. In the early years, for example, the temperature was recorded only on week days, not every day; and, of course, the instruments used were not as good as those used today. Nevertheless, the yearly averages from the year 1722 are shown in the next graph. Note that the numbers shown are the averages of the 365¼ daily average temperatures each year — if you want more details, then you can also look at the seasonal average temperatures here.

Average temperatures in Uppsala, Sweden, over the past 300 years.

Note that the interest is in temperature change, and so the graph is centered on the long-term average temperature, with blue years being below average and red years being above average. The recent cluster of warm decades is pretty obviously anomalous over the 3 centuries shown. Aside: being a Swede, Celsius was interested in how cold it gets, not how hot it gets, and so his original scale had water freezing at 100 °C and boiling at 0 °C — it was some time before it was inverted to the current form.

If we stick to the idea of yearly temperatures, then we can actually go back a bit further than the daily record. Gordon Manley has compiled the monthly mean temperatures for the Midlands region of England from the year 1659; and these are shown in the next graph, from the American Association of Wine Economists. Once again, the recent trend is clearly anomalous. [Note that the Midlands is on average 4°C warmer than the Uppsala region!]

Temperatures in central England over the past 350 years.

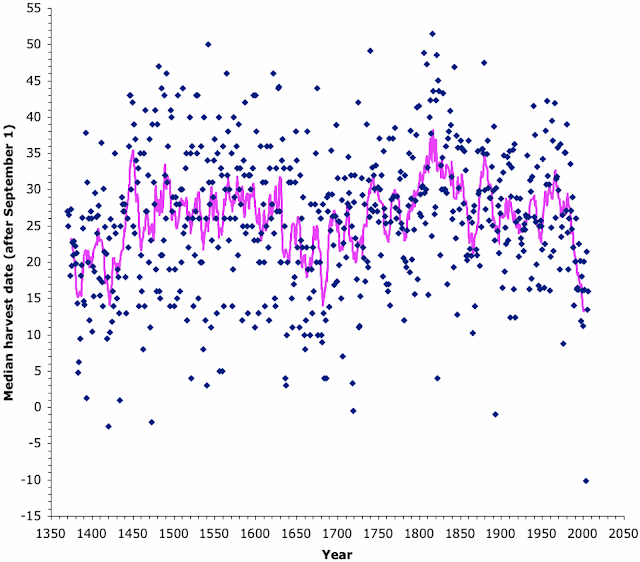
Finally, I have noted before (Grape harvest dates and the evidence for global warming) that grape harvest dates can be used as a reasonably accurate record of annual (summer) temperature variation, although obviously not as good as instrument measurements. There are formal records for the Burgundy region of France that go back to the late 1300s, which takes us back another 3 centuries before the above graphs. The data are shown in the final graph — as before, the recent trend is completely anomalous.

Grape harvest dates in Burgundy over the past 650 years.


Conclusion

Points 1 and 2 listed above do not seem to me to require much discussion, even by skeptics — we have clear temperature records, and we know how carbon dioxide works. Fortunately, for many people point 3 has moved beyond discussion, and into action.
Monday, April 22, 2019

Introducing the "Responsible Alcohol Marketing Scheme"

If you look up "ABAC" on Wikipedia you will currently find five choices of meaning, but none of these refers to the Alcohol Beverages Advertising Code. This is a voluntary code of conduct for the alcohol industry in Australia (also known as Australia’s Responsible Alcohol Marketing Scheme). I though that the ideas behind this scheme might be of interest to some of the readers of this blog.


There are, of course, various codes of conduct for the alcohol industry, notably the Code of Responsible Practices for Beverage Alcohol Advertising and Marketing, provided by the Distilled Spirits Council of the United States. However, the sort of self-regulatory initiative that I am discussing in this blog post is precisely the sort of thing that it much easier to organize in a relatively small country like Australia, since it is much easier to make implementation national.

The intention of ABAC is not just to provide the alcohol industry with some idea of "best practises" for advertising and packaging, rather than some sort of free-for-all. Instead, the main intention is to provide a quasi-regulatory system for alcohol advertising and packaging, which is separate from any other codes that might apply to advertising in general. Whether such a Code can work in practice is something that is yet to be determined; and I discuss this below.

The ABAC Scheme was introduced in 1998, and can be thought of as the centre-piece of Australia's self-regulatory system for alcohol advertising and packaging. The Code is designed to ensure that alcohol advertising will be "conducted in a manner which neither conflicts with nor detracts from the need for responsibility and moderation in liquor merchandising and consumption, and which does not encourage consumption by underage persons."

The guidelines have been negotiated with the national government, but consumer complaints are handled independently. ABAC is administered by a Management Committee that includes industry, advertising and government representatives, currently with representatives from the Brewers Association of Australia, the Spirits & Cocktails Australia, Australian Grape & Wine, and The Communications Council. All costs are borne by the alcohol industry.

There are actually only two main practical things that the ABAC Committee oversees:
  1. provide a pre-vetting assessment of intended advertisements
  2. adjudicate public complaints about existing advertisements.
In its quarterly and annual reports, ABAC has always laid stress on the usefulness of their voluntary Alcohol Advertising Pre-Vetting Service, as a means to avoid potential problems for the advertisers (e.g. ABAC highlights the benefit of pre-vetting adverts; ABAC report highlights importance of pre-vetting). In effect, any ad that passes the pre-vetting process should not generate any complaints that would be upheld by the adjudication process. In 2018, ABAC received 1,751 pre-vetting requests (see ABAC Scheme releases 2018 Annual Report).

Complaints about an advertisement or packaging are dealt with by an Adjudication Panel:
During 2018 the rules were tested by complaints, including by public health groups, resulting in the highest number of determinations (61) and the highest number of Code breaches (21 complaints upheld) in the 20+ year history of ABAC.
The most complained-about marketing campaign in 2018 was for Rusty Yak Ginger Ale, with 13 complaints made, but these were outside ABAC’s jurisdiction, as the concerns were unrelated to alcohol as a product, but were concerned with discrimination against a sector of the community [people with red hair!].
It seems a bit odd that "discrimination against a sector of the community" is not within ABAC's remit.

Comments and criticisms

From 1998-2003 ABAC was fully administered by the alcohol industry itself, via the Australian Associated Brewers, the Distilled Spirits Industry Council of Australia, the Liquor Merchants’ Association of Australia, and the Winemakers’ Federation of Australia. However, a formal review by a National Committee for the Review of Alcohol Advertising, on behalf of the Ministerial Council for Drug Strategy, concluded that the system was seriously deficient and had failed to ensure alcohol advertising complied with the ABAC (see A decade of failure: self-regulation of alcohol advertising in Australia). This review had followed a prior critical report from academia (The decline of ethics or the failure of self-regulation? The case of alcohol advertising). The ABAC system was then modified to its current management form.

I haven't seen much in the way of complaints about ABAC from within the alcohol industry. Indeed, they seem to be of the opinion that it is working perfectly. However, there have been a few academic research papers that question the success of the current scheme.

There is a very interesting literature review, from 2013, comparing the regulation of alcohol advertising in Australia, New Zealand, Canada and the United Kingdom (Regulation of alcohol advertising: Policy options for Australia). It concludes that there is "considerable evidence that alcohol advertising influences drinking behaviours, and that current regulatory systems based on co-regulation and voluntary regulation (as is the case in Australia) are ineffective."

Academic criticism of the ineffectiveness of ABAC has continued over the past decade. For example, Donovan et al. (Magazine alcohol advertising compliance with the Australian Alcoholic Beverages Advertising Code) found that:
52% of items appeared to contravene at least one section of the ABAC. The two major apparent breaches related to section B — the items having a strong appeal to adolescents (34%) and to section C — promoting positive social, sexual and psychological expectancies of consumption (28%).
Similarly, Pierce et al. (Regulation of alcohol marketing in Australia: a critical review of the Alcohol Beverages Advertising Code Scheme’s new Placement Rules) concluded that:
[the rules for placement of advertising] are inadequately defined and narrow in scope, resulting in the dismissal of almost all relevant complaints. Weaknesses identified in the regulatory processes include limited representation from external stakeholders in the development of the Placement Rules, a lack of transparency and independence in the Scheme’s administration, and limited monitoring and enforcement options.

One specific example of the critical comments about ABAC refers to sports advertising (Don’t worry about the kids: Let’s just protect the alcohol industry). It is worth quoting at some length:
The broadcast of alcohol advertisements on commercial television in Australia is restricted in order to limit the exposure of young people to alcohol advertising. Alcohol advertising is only permitted during periods of M (mature classification), MA (mature audience classification) or AV (adult violence classification) programs (which are restricted to between 8:30pm and 5.00am).
The one – completely counter-intuitive – exception to this is that the broadcast of alcohol advertisements is permitted during the live broadcast of sporting events on weekends and public holidays. It is not surprising that this "exception" results in alcohol advertising being shown at the time that children and teenagers are most likely to see it and most likely to be influenced by it.
In relation to sport, the current iteration of the Alcohol Beverages Advertising Code (ABAC) states that a Marketing Communication must NOT show (visibly, audibly or by direct implication) the consumption or presence of an Alcohol Beverage as a cause of or contributing to the achievement of personal, business, social, sporting, sexual or other success.
The previous version of the Code also used to say that alcohol advertisements must NOT “depict any direct association between the consumption of alcohol beverages, other than low alcohol beverages, and the operation of a motor vehicle, boat or aircraft or the engagement in any sport (including swimming and water sports) or potentially hazardous activity” but now it says “before or during any activity that, for safety reasons, requires a high degree of alertness or physical co-ordination, such as the control of a motor vehicle, boat or machinery or swimming”.
Somehow, in its efforts to toughen up the Code and better protect kids from inappropriate messages about alcohol, the ABAC managed to drop the specific reference to sport. Does that make you wonder whose well-being they are protecting?
Needless to say, the sports industry is full supportive of the alcohol industry in this case (Sport codes lay into proposed alcohol advertising laws, say it will hurt industry). As one example of this, see Calabria Family Wines becomes official wine partner of the Collingwood Football Club, where:
Calabria Family Wines branding will reach the more than one million people who attend Collingwood matches each season and be exposed to the club’s enormous social media, free-to-air and pay-TV audiences.
Conclusion

ABAC is unusual worldwide, as an example of voluntary sel-regulation. The idea of self-regulation is a good one, if it can be put into practice effectively. However, there is obviously some way to go before the alcohol industry in Australia advertises all of its products in a socially acceptable manner.

Monday, April 15, 2019

How different are regional vintage quality-scores from different sources?

I have written quite a few blog posts about the quality scores given by commentators to individual wines for each vintage. However, there is another type of wine score, as well: the annual scores given for whole wine-making regions.

Indeed, there are plenty of wine sites that are happy to score the different vintages for quite a variety of regions, using all sorts of scoring schemes (5 points, 10 points, 20 points, 100 points, etc). I have no idea how worthwhile such scores might be, although I assume that a single score for a whole country or continent (eg. Australia) is rather useless.

What I have always wondered is whether these scores are all telling me the same thing. That is, do the different sources of the scores agree on vintage quality? If so, then why are there so many different scores? If not, then who agrees with whom? This blog post is designed to provide some answers to these questions.


Vintage scores are erratically available, both as to which wine regions have scores and which vintages have scores. Europe has very standardized vineyard areas, and so most of the available scores apply to one or more of those regions. So, I have collated data from every scoring scheme I could find, for every region in Europe.

However, for the simple purposes here, I will focus on the most well-studied wine types of France only:
  • Red Burgundy
  • White Burgundy
  • Red Bordeaux
  • Sauternes
  • Red Rhone
Most of the other French regions (eg. Loire, Alsace) have data from only a few of the scoring schemes.

I will also focus on those 9 of the schemes that have the most complete data:
Finally, I have included the data from the years 1990—2015 inclusive (ie. 26 vintages). The data are less complete among the schemes for other years.

Results

Since there are 9 scoring schemes, 5 regions and 26 years, there is no simple way to construct a picture of the dataset, or even three separate pictures. So I have used the form of multivariate data summary described in my post Summarizing multi-dimensional wine data as graphs, Part 2: networks. The details of the analysis are listed at the bottom of this post. The main thing is to understand how to interpret the network pictures.

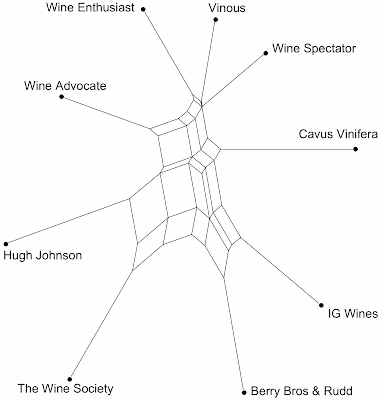
This first network shows the 9 scoring schemes. Each scheme is represented by a dot in the network. Schemes that are closely connected in the network are similar to each other based on their vintage scores across all of the 5 regions and 26 vintages, and those that are further apart are progressively more different from each other.

Comparison of 9 scoring schemes for wine vintage quality in France


So, the first thing we can notice is that none of the schemes are in very close agreement with each other, as each has its own long terminal edge. However, the network shows that the Wine Enthusiast, Wine Spectator and Vinous schemes are all rather similar to each other, followed by the Wine Advocate. This is reassuring — the vintage quality scores are apparently not arbitrary! In a more practical sense, it probably does not matter much which of these schemes we choose to consult.

However, the other 5 scoring schemes become progressively more different as we move down towards the bottom of the network. Only pairs of schemes seem to share some features — Hugh Johnson + Wine Society, Wine Society + Berry Brothers, Berry Brothers + IG Wines. The Cavus Vinifera scheme has complex relationships to the 4 schemes at the top and to the 4 schemes at the bottom.

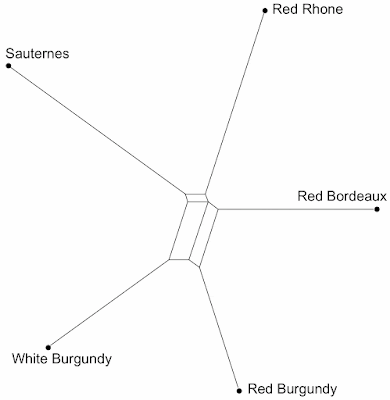
Next, we can look at the 5 wine types. As above, each vineyard region is represented by a dot in the network; and regions that are closely connected in the network are similar to each other based on their vintage scores across the 9 schemes and 26 vintages, while those that are further apart are progressively more different from each other.

Comparison of vintage quality for 5 French wine regions

We can, once again, note that the 5 wine types are not especially similar to each other in terms of which years are "good" and which not. However, we can see that the two white wines are loosely grouped at the left of the network and the 3 red at the right; and the 2 Burgundy wines are loosely grouped at the bottom. So, there are actually some consistent patterns across the 26 vintages. I am not sure whether the grouping of the Rhone wines with the Bordeaux wines is of any practical significance.

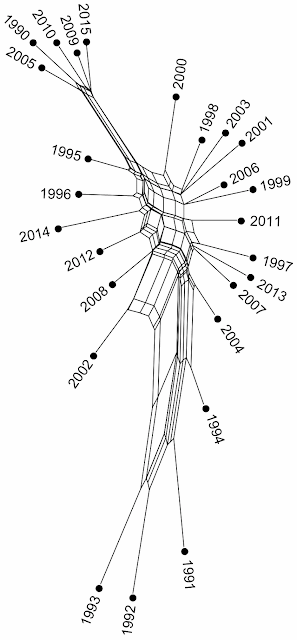
Finally, we can look at what the original scorers might think is most important: the vintages themselves. As above, each vintage is represented by a dot in the network; and vintages that are closely connected in the network are similar to each other based on their vintage scores across the 9 schemes and 5 wine types, while those that are further apart are progressively more different from each other. So, we are looking at a general summary of French vintages, rather than any particular vineyard region.

Comparison of quality for 26 French wine vintages

Those 5 vintages that all of the schemes rated most highly are grouped at the top of the network, and the 3 worst ones are at the bottom. Note that the 1990 vintage, which was a good one across all of western Europe, not just France, was immediately followed by the 4 worst vintages.

There is some disagreement about the other vintages, as 6 of them are arranged at the left of the network, and the remainder at the right, although they still generally run from top to bottom as better to worse. This variation is due to which scoring schemes preferred which vintages. For example, the 2002 vintage actually received scores that ranged from 5 to 9, even for the same region, which did not happen for the vintages at the top of the network, which all got 8–10.

Conclusion

There is a lot of similarity among the scoring schemes for regional vintage quality, but not as much as we might like. Presumably, personal preferences are playing a large part in the scores assigned. Indeed, the scoring differences between schemes are often larger than are the differences between regions.


Methods

The various scoring schemes were first standardized to the same scale of 10 points:
   10-point scale: left alone
   20-point scale: 10 = 20 / 2
   100-point scale: 10 = (100 - 50) / 5
Of the 1,170 observations, 15 were missing (1.3%). These were interpolated using the minimum-variance method, based on row and column averages.

Three datasets were then constructed, one with the Schemes as the objects, one with the Regions as the objects, and one with the Years as the objects.

For each dataset, the pairwise distances between the objects were calculated using the Manhattan metric. A Neighbor-Net was then calculated based on these distances, using the SplitsTree program.

Monday, April 8, 2019

Younger U.S. consumers prefer Australasian wine

A couple of weeks ago I discussed the disadvantage of trying to lump generations into cohorts of consumers (Millenials do not exist: so why market to them?). This does not mean, however, that the age of consumers has no effect on their behavior. A case in point is the preference of younger consumers for imported wine.

The focus of discussion for imported wine in the USA has usually been on volume and value, particularly which countries are increasing and which are decreasing their sales. However, there is another interesting aspect, which is market penetration for drinkers of different ages. It has long been noted that the younger US generations buy more imported wine than do their parents. For example, this was noted back in 2006 for the so-called Millenial generation, and it has been re-iterated in 2013, 2015, 2017 and 2018 for the so-called Post-Millenials (or iGeneration or Generation Z). There is apparently nothing unusual about this — for example, it has also been noted that "in Albania, younger consumers preferred Italian wines whereas older consumers preferred domestic wines."


This trend has been seen as a "good news-bad news situation [for the US wine industry]. While Millennials are drinking more wine — the good news — much of it is imported wine, which is the bad news ... imports are nearly at an all-time high, and that is a challenge of great importance to domestic producers." The State Of The Wine Industry 2018 report noted that "bottled import wine has been highest for those coming from France, New Zealand and Italy (15.2%, 10.7% and 2.4%, respectively) while slightly negative for Australia, Spain, Argentina and Chile." However, this misses a key point — the age of the consumers.

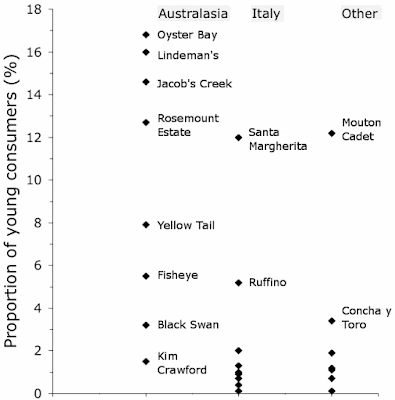
What about younger drinkers, usually defined as being less than 25 years old (the Post-Millenials)? Obviously, these people are part of the key to the future of any industry (Forecasting wine's future: America is now wine's biggest market, and younger drinkers are starting to shape it), as they now constitute 25% of the US population. So, which imported wines do they prefer? It turns out to be Australasian wine. [Note that Australasia = Australia plus New Zealand; see Wikipedia.] I have not seen this topic being discussed very much.

The current situation is illustrated in the following graph. It shows the share of young consumers for the top 24 imported wine brands in the U.S. in 2016, taken from the American Association of Wine Economists' Facebook page. Clearly, the Australasian brands generally have much greater market penetration among young drinkers than do imported wine brands from elsewhere.

Proportion of young consumers for 24 wine brands imported into the USA

There is presumably a message here for wine marketers, although exactly what that message might be is not necessarily clear:
  • Are the Australasians making wines that appeal to young people? It certainly seems so (see below).
  • Is their advertising directed at young people? We are constantly being told that modern people have very different behavior as consumers from their parents. Wine has long had an image that you have to be "old, white and rich" to drink it.
  • Is the price right for young people? We are constantly reminded that Millennials and Post-millenials have much less disposable income that did previous cohorts. "Ambitious" pricing is usually restricted to local wines, because importers know that they have to compete on price (see Millennials and Napa cabernet: an uneasy relationship).
  • Are the Italians, in particular, doing something wrong? Perhaps they are using old-fashioned marketing strategies — social media seems to have taken a dominating importance in reaching younger consumers (see How to market wine to Millennials).
Modern marketing discussions focus, of course, on the first point — how to market to younger generations; see, for example:
The main points about younger people from these discussions are: the importance of brand recognition; the focus on quality and value rather than a wine's origin; sweeter varietals as part of their introduction to wine; the relative lack of interest in the details of varieties and appellations; and an interest in visually distinctive labeling. Most importantly, the younger generations are reported to have an interest that extends beyond what’s in the glass. There must be a broader experience, which can be achieved, for example, using augmented reality labels to tell a bigger story (eg. check out the 19 Crimes label, which is the top Australian wine over $10).*


Australasian wine marketing seems to be leading the way with these ideas (see More wine drinkers in U.S. market, but Aussie marketing, not domestic brand names, draw younger consumers). This has been of particular interest to Wine Australia, the nationally funded statutory body servicing the Australian grape and wine community (see Embracing the evolution in the USA market).

So, maybe the marketing problem is not so much trying to sell wine to young Americans, as trying to sell American wine to young Americans. We are told that they expect an "experience" from their consumables, and exotic wine can be part of that experience. Trying to market "being an American" as part of a wine experience may not have all that much impact, because the buyers are likely to think that they already have this experience, without the wine.


* To quote from my own ancestry:
Elizabeth Mitchell: "Convicted on 6 March 1790 at the Assizes. Her crime was aiding and abetting in breaking into a dwelling in Studley, North Wiltshire, and the stealing of 5 cheeses and sundry other articles. She was sentenced to 7 years transportation. Transported on the Mary Ann, arriving Sydney 9 July 1791."
Can you believe that the British once treated their fellow citizens like this? Apparently cheese was more valued in Wiltshire than were humans.

Monday, April 1, 2019

A gift for wine lovers (on April 1)

The concept of "wine on tap" is relatively new, although its popularity is rising in bars and hotels. It has apparently even made it into up-scale restaurants, which are installing wine taps to reduce waste and save money, space and time.


However, what about home usage? A wine tap is going to take up a lot of living-room space. Fortunately, we need not feel left out. For the rest of us, there is the new USB Wine. You can see it in action in the following video. [If the following space appears to be blank, click in it for the video to appear.]


Enjoy your April 1.