Monday, December 26, 2022

Hangovers — is there anything to be done?

Many of you will have experienced the phenomenon usually called a hangover. It occurs after drinking alcohol; and it has features like: headache, dehydration, fatigue, and nausea. Basically, it is your body’s way of saying: “Don't do this again, you idiot.”  *

Every time you turn around there is someone telling you how to avoid / cure a hangover. Apart from the obvious method (don’t drink the alcohol in the first place), there have been the usual traditional herbal remedies, as well as various behavioral strategies:
Indeed, the size of the global market for hangover-cure products is estimated to be $US 1.5 billion.


However, have you ever looked at the actual scientific evidence evaluating any of these claims? Of course not! Well, in honor of the Christmas / New Year period, I have done this for you, to save you the time. (My profession was that of a biological scientist; and I taught postgraduate students about the design and analysis of scientific experiments.)

Apparently, Americans drink more during holidays, and are quite likely to feel the effects of a hangover after 3—4 drinks (33% women, 23% men) (see a recent small survey). The same survey even claimed that “many would give up social media for no hangovers”. Now, that is serious!

Actually, one occasion for looking at this is the recent release in the USA of the latest addition to these lists, that I know of, which is called Myrkl. (Yes, that is pronounced as ‘miracle’.) It is produced by a Swedish company (De Faire Medical), who claim to have spent 30 years working on it. (They do not say how many drinks that adds up to.) This claims to be a type of food supplement: “Take two pills before drinking, and feel refreshed the next day” (Myrkl, the revolutionary pre-drinking pill, enters U.S. market just in time for the festive season, following overwhelming success in the UK). I have not tried it, myself.


There have been several formal overviews of scientific publications involving experiments about this topic, including:
  • Interventions for preventing or treating alcohol hangover: systematic review of randomised controlled trials. British Medical Journal (2005) 331(7531): 1515-1518.
  • Unknown safety and efficacy of alcohol hangover treatments puts consumers at risk. Addictive Behaviors (2021) 122: 107029.
  • The efficacy and tolerability of pharmacologically active interventions for alcohol-induced hangover symptomatology: a systematic review of the evidence from randomised placebo-controlled trials. Addiction (2022) 117: 2157-2167.
Sadly, the results are exactly as I would expect them to be. None of the reviews thought that any of the experiments was particularly well done, as an experiment. The problem is, of course, getting people to take part in the experiments, and to behave in a suitable manner while in the experiment. Put formally, and therefore politely: “only very low quality evidence of efficacy is available”.

In particular, many of the suggested treatments contain one or more vitamins for which the dose exceeds the corresponding daily recommended intake level, and sometimes even exceeds what is referred to as the tolerable upper intake level. Be assured:- over-dosing on vitamins is no way to treat over-dosing on alcohol. Some products even contain NAC (What are the benefits of NAC [N-acetylcysteine]?), which is actually registered as a drug, by the US Food and Drug Administration, and is prohibited in the USA as an ingredient in dietary supplements or foods.

I am sorry to have to report this situation; but this is why you never hear of scientifically recommended hangover cures or preventions. As one of the studies concluded:
No compelling evidence exists to suggest that any conventional or complementary intervention is effective for preventing or treating alcohol hangover. The most effective way to avoid the symptoms of alcohol induced hangover is to practise abstinence or moderation.

One important issue here is that the amount of alcohol necessary to create a hangover differs greatly between people. Our bodies produce alcohol every day as a natural by-product of carbohydrate metabolism; and this is easily dealt with by the liver. However, above a certain amount the liver is overwhelmed. Alcohol then acts as a poison, maiming and eventually killing cells, especially those in the stomach and intestines (Body cells exact cruel revenge for indulging in too much holiday spirit). So, both causes and cures of the morning—after syndrome are highly individual.

One of the strongest effects of alcohol is dehydration, since dealing with it in your body causes you to urinate excessively; and so perhaps your best bet is simply to drink lots of water, along with the alcohol.


* According to the 2021 Global Drug Survey, people's biggest regrets about getting drunk are a terrible hangover, followed by saying something they wouldn't normally say, then heightened anxiety the next day, and getting into fights.

Monday, December 19, 2022

The wine industry needs to move into the 21st century

I can’t believe how behind-the-times the wine industry sometimes seems to be. Take the matter of labeling retail wine containers with their contents. If someone is selling me something to put into my body, and digest, so that it potentially becomes a part of me, I expect to be told what I am being given. But I cannot currently expect this from the wine industry. It makes me think that there might be something that they don’t want me to know.

Labeling has often been very important in the wine industry, in Europe at least. After all, the entire concept of named vineyard areas is based upon the label that you can put on the wine, not what wines you can actually make in that region. For example, the French Appellation Controlée systems refers literally to “controlled name”, not controlled wine-making. Labeling of wines has been important, in this sense, in terms of the grape varieties.

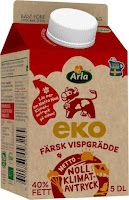
KRAV cream container

Let’s look at the current situation for wine labeling compared to other food products.

If I pick up a carton of Fresh Cream (grädde), here in Sweden, the package labeling provides me with two sets of information about the contents. First, the Ingredients consist of: Pasteurized milk. I am also told that these ingredients meet the KRAV requirements, indicating proper “ecological / organic” food. Second, I am told the Nutritional Value of the cream's components: Energy (kJ/kCal), Fat (including Edible Fat separately), Carbohydrate (including Sugars separately), Protein, Salt, and Vitamins (several listed independently).

If I look at my bottle of Swedish Christmas carbonated drink (called JulMust), I get the same two sets of information. In this case, the Ingredients are (in descending order): Carbonated water, Sugar, Caramel coloring, Natural hops, Grain malt, Citric acid, Spice flavorings, and Preservative E211. This is not exactly nutritious, but holiday-celebration drinks rarely are. The Nutritional Values do not mention any vitamins, sadly.

On the other hand, my bottles of wine do not even tell me that they contain grapes. (Maybe they don’t have any actual grapes??!!) I get told that the bottle contains Sulfites (which is a potential allergen*), in a dozen different languages, and Alcohol (%). And that is it. This makes me think that the wine industry does not take itself very seriously.

Even my beers do better than this. My two current bottles of Christmas Beer (called JulÖl) both contain the same list of Ingredients (in order): Water, Barley malt, Hops, and Yeast. There are no Nutritional Values; but they both have 3.5% alcohol.

Selection of julmust drinks

There are two possible issues here. First, why has this exemption for the wine industry been allowed to exist in the modern world? Second, what is the wine industry doing to rectify this social anomaly?

The first answer is, of course: “tradition”, which generates inertia. When we used goat skins as wine containers, we did not label them, and probably very wisely so (they were certainly not meant for long-term storage). When we bought our wine from wooden barrels in some sleazy back-street dive, the same thing applied — the less we knew, the better (and we drank it straight away). But this is the 21st century now, and those days are long gone, and wisely so, if only from a health perspective.

The second answer is, sadly, “very, very little”. This saddens me because the wine industry has adapted to the current century so well in so many ways — why not this one? I am not a young man (I will turn 65 soon), and I can remember quite a fair bit of the previous century; and so I can remember the days when no foods contained legally required labels about what the customer was getting. It literally was a case of Buyer Beware, in the mid-20th century.

However, in those days shops were shops, not supermarkets; and the person behind the counter often felt personally responsible for the quality of what was passing over the counter (in both directions!). Milk was often delivered to the house, and bread was bought fresh. Those days are gone for most people in the Western World; and in the modern world we rely on labeled goods bought from large sellers (big box and grocery store wine shelves), so that the labels are important to us, because they are all we have.

Wine serving facts

The European Union has made the decision to bring its local wine industry into the modern world. They are not doing this fast, mind you, and do not require contents labeling of wine for another year, or so. This still, however, puts them way ahead of the USA, which is only now just getting around to even studying the issue.

The EU decision was made in December 2021 (EU Regulation 2021/2117), and applies to retail products sold in the EU from December 2023. It compulsorily requires both the list of ingredients and the nutrition declaration, for wine, de-alcoholized and partially de-alcoholized wine, and aromatized wine, no matter where the source. Wine ingredients could, of course, include water, grapes, or grape concentrate (eg Mega Purple), yeast, white sugar (if the grapes are not ripe enough), tartaric acid (to increase acidity) or calcium carbonate (to reduce acidity), powdered oak (for tannins), and sulfur dioxide (aka sulfites, as a preservative). Actually, the U.S. Alcohol and Tobacco Tax and Trade Bureau (TTB) has approved more than 60 additives for use in wine (Why does Ridge add ingredients to its back labels?).

Unfortunately, the EU-mandated information (except the Energy value) does not have to actually be on the label itself, but can be provided electronically, such as a web link accessed via a QR code on the label. I, myself, do not have an internet—friendly phone (mine deals solely with phone calls and SMSs), and so therefore this new information will be hidden from me, in the wine-store. This is what we used to call the Generation Gap — I am from the Baby Boomer generation, not Generations X, Y or Z, and therefore was not born with a mobile phone in my hand. I can still remember Superman-getting-changed style phone booths, and the necessity for having a pocket full of coins in order to use them. So, maybe I need to get into the 21st century, too, along with the wine industry? (My wife occasionally encourages me to do so.)

Ridge Vineyards label

As for the USA, well they can’t even agree to always tell us what the grape varieties are, let alone tell us where those grapes actually come from (Controversy erupts over label laws).** This is because alcohol is regulated by the TTB, not the Food and Drug Administration (FDA), which does require label on all of its regulated products. This separation is a legacy of Prohibition, of course (This is why alcohol doesn't come with nutrition facts).

So, the authorities are continuing to be cautious (Cheers to alcohol facts labeling to finally be addressed by TTB), which I think means: “we will see how it goes in the EU, before we decide anything”. It has, however, been suggested that being forced into action would be a good thing (Wine labeling could be a blessing in disguise), especially for we poor consumers, who apparently have wildly varying ideas about what is actually in our retail wines (Winners and losers in new consumer study on nutritional and ingredient wine labeling).

Apparently, the US wine industry is in two minds about how to react to this (What’s in a label?). The issue really does seem to be concern over how the wine-buying public will react to explicitly knowing about some of wine's actual ingredients (Nutrition facts will soon appear on some wine bottles, and they might surprise you). Nevertheless, if nothing else, the wine world is becoming focused on premiumization and reduced alcohol, in a world of younger buyers. They seem to care more about knowing what they are putting in their mouths than their parents and grandparents did (wine drinkers are currently characterized as mainly 40-65+ years old). I think that the wine industry should be eager to tell these youngsters, rather than reluctant.


* Sulfite allergic reactions are usually suggested to be uncommon, rather than more obvious ones like histamines (What gives you a wine hangover? It’s probably not the sulfites). They are singled out for mention because when there is a reaction it can be very serious, particularly among asthmatics (Why do i get headaches from wine?).

** The new concept of blends from different countries (Is ‘borderless’ wine the future?) emphasizes the need for clarity.

Monday, December 12, 2022

Increase in U.S. per capita wine consumption / expenditure this century

I have written before about the relationship between how much wine people drink and how much they actually pay for it (The cost of wine consumed differs greatly between countries); and I will return to that topic again soon. However, before then, I will look at one particular country: the United States of America.

What I will do here is look at the relationship between per capita wine consumption versus per capita expenditure on wine, throughout this century. As a quick preview, Americans have consistently increased both their consumption and their expenditure, per person, through time.


The data that I have used come from the Annual Database of National Beverage Consumption Volumes and Expenditures, 1950 to 2015, by A.J. Holmes and K. Anderson (Wine Economics Research Centre, University of Adelaide, July 2017). Tables 1.17 (Wine consumption per capita, in liters of alcohol) and 1.22 (Wine expenditure per capita, in $US) contain the information that we need.

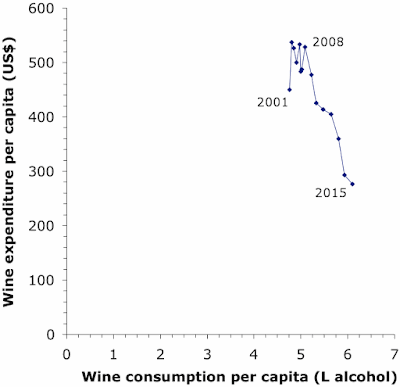
The result for the United States is shown in the first graph, for the years 2001 to 2015. Each point represents one year, located vertically based on the amount of money (in $US) spent on wine during that year per person, and horizontally based on the liters of alcohol consumed as wine per person. Several of the years are labeled.

US per capita wine consumption and expenditure

The main pattern in the data is clear — Americans, on average, increased their wine consumption and expenditure pretty much by the same amount every year. Does this surprise you? (Remember: this is per person, not the total for the whole country — the wine-drinking population has grown, but this has no effect in the graph.) Interestingly, the consumption and expenditure increase together — Americans are not “drinking better” now compared to earlier, but are still spending roughly the same amount per bottle as they were before (they are just drinking more bottles).

There was only one exception to this pattern: the year 2009 involved a drop in expenditure but not volume, followed by a return to the same increase the next year. Most of you will remember (not fondly) the Global Financial Crisis of 2007—2008. This was reported as the most serious financial crisis since the Great Depression (1929). Instead of taking to drink, Americans (and many others) cut back on their drink expenditure but not volume. However, they apparently recovered pretty quickly, compared to the situation a century earlier.

Lest you think that increasing wine consumption per person is inevitable in the modern world, we could look at a comparison country, to see what happened there. An obvious comparison would be one from the Old World, with its long tradition of wine consumption, so why not pick France? This next graph shows exactly the same information as above, but this time for the French people, up until 2015.

France per capita wine consumption and expenditure

As you can see, things are quite different. Note, first, the dramatically different scales for the two graphs — French consumption and expenditure both greatly exceed those of Americans. The USA has a long way to go!

Furthermore, there was uncertainty in consumption for the first 8—9 years of the century, but it has been all downhill since then. The GFC obviously had an effect in 2007 and 2008; but it is almost like the French then gave up at that stage, and started to drop the idea of drinking quite so much wine, altogether. Once again, the volume and expenditure dropped together, so that the people drank the same quality of wine, just less of it.

It is certainly a pity that the available data end in 2015. It would be interesting to see how the patterns have continued in recent years. For example, we are told that: U.S. wine sales have been in a slump in recent years, with a 5.2% decrease in overall wine sales year over year (according to Nielsen IQ). In particular, it has been reported that currently: Consumers choose to drink less to save more (a key economizing strategy for rising inflation). However, we are also told that Premiumisation continues, implying that more is being spent per bottle, but with  fewer bottles.

Similarly, in France wine consumption has continued to decline. In 2020, the national consumption was only three-quarters of what it had been in 2007 (Statista). Apparently, wine is now seen as a more occasional indulgence, rather than a daily necessity (Why are the French drinking less wine?). The younger generation may well think that they drink less but better, if their expenditure has not decreased as much as the volume.

Monday, December 5, 2022

Wine versus beer consumption, worldwide

Alcohol consumption is typically characterized as being via intake of either wine, beer or spirits. This is so, no matter how much or how little alcohol is actually consumed. I have touched on this topic before, by ignoring spirits, and thus focusing on wine and beer (Beer countries and wine countries). In that case, I looked at per capita consumption in 2015, for 47 countries. It is time to update this a bit, and study percentages instead of volume.


I have had a look at the data for 2018, as contained in the Annual Database of Global Wine Markets, compiled by Anderson,  Nelgen and Pinilla. Tables 53a (Wine's share of total alcohol consumption volume) and 53b (Beer's share of total alcohol consumption volume) contain the information that we want, for each country.

Note that we need to standardize the data for each country, in order to deal with different population sizes and demographies, as well as standardizing for alcohol content, since wine has up to three times as much as beer. So, the data refer to the percentage of national alcohol consumption that is made up by wine and by beer.

The result is shown in the graph, for 48 countries. Each point represents one country, located vertically based on liters of alcohol consumed as beer during 2018, and horizontally based on liters of alcohol consumed as wine during 2018.

I have labeled 29 of the countries, for discussion; I have also colored (rather than labeled) the three Scandinavian countries (Denmark, Norway, Sweden). The pink line indicates equality of consumption — the countries above the line consume more alcohol via beer than wine, and those below the line consume more alcohol via wine than beer. There are 14 countries in the latter group, plus New Zealand sitting pretty much on the fence.

Per capita consumption of wine and beer

As expected, there is generally a negative relationship between beer and wine consumption — the more wine you consume then the less beer that you can consume (since beer + wine + spirits must add up to 100%). There are however, a few countries in the bottom left-hand part of the graph, which consume very little wine, and do not make this up with all that much beer consumption, either. That is, spirits make up a lot of the alcohol; but remember, these (mostly Asian) countries actually consume very little alcohol at all, even spirits. On the other hand, the countries just to the right of China (in the graph) are: Bulgaria, Russia, and the Ukraine — these do consume a lot of spirits rather than either beer or wine.

As we might expect, a few well-known wine-producing countries are in the bottom right-hand corner of the graph. However, the four unlabeled countries in that region are: Greece, Morocco, Switzerland, and Uruguay, which are not big wine producers. Did you expect Morocco, even though it does not consume much alcohol at all, to drink more wine than beer? (Perhaps the lingering French colonial influence.)

The Scandinavian countries (in pink) are pretty close to the line of equality, along with Hungary and New Zealand, plus Algeria (unlabeled). Scandinavia has principally been a beer-drinking world (after they stopped drinking honey mead, long ago); but things have changed a lot in recent decades — this has a lot to do with having government-owned wine retailing (see: Wine monopolies, and the availability of wine). Nevertheless, Sweden is actually known to beer producers as a great market for boutique beers (there are even beers that are sold only in Sweden and their homeland) — at this time of the year, we have become awash in Christmas beers.

Note, also, that Australia and the United Kingdom are not all that much more in favor of beer than is New Zealand. The USA, on the other hand, is distinctly more in favor of beer; and this matters commercially, given that it has the third-biggest population on the planet. South Africa is even more in favor of beer, in spite of its thriving wine industry.

The difference between wine-producing and non-producing countries is particularly obvious for South America. Argentina (producing lots of wine) is well to the right in the graph (consuming lots of wine), while Brazil (producing very little wine) is way to the left (consuming very little wine), with Chile (unlabeled) half-way in between (in both aspects).


Clearly, this graph indicates where the wine industry could usefully put in some effort, in terms of attracting customers. In particular, there is clearly more work to do by the United States wine-makers!