Now, there is nothing wrong with numbers per se, as any tax accountant will tell you. After all, finance is based on numbers, although for wine consumers the only financial number is actually the price of the container and its contents.
So, as consumers. we can see things the following way. The wine supplier (whether winery or retailer) applies their own mathematical assessment of the wine quality by deciding on its price. The wine commentator (or critic) then applies their own mathematical assessment of the wine quality by deciding on a score. We get two numbers, not one; and we have to make something of this situation, before purchasing tonight’s dinner wine.
The main issue, then, for us, regarding the application of numbers to an assessment of wine quality is potential bias in the choice of any given number, either by the initial wine supplier or by the subsequent commentator tasting the wine.
For the suppliers, on the one hand, some biases are trivially obvious. For example, the wine will be sold for a number like $9.99 not $10, which apparently really does increase sales. Other biases are less obvious but equally to be expected. For example, since all mass-produced wines taste pretty much the same, I would need to take into account my competitors’ prices when setting my own price, otherwise I am potentially short-changing myself. Mathematically, this called Regression to the Mean, where a set of variable numbers change through time to all end up being the same as the average.
For wine commentators, on the other hand, the most common accusation regarding bias is having a small range of scores, all of which are quite high. So, the common 100-point scale is no such thing. First of all, it starts at 50, not 0, and scores below 80 rarely exist in practice, making it a 20-point scale. Moreover, scores in the range 90–95 are depressingly common, as are scores of 95–98, these days. Apparently high-quality wines all taste the same, just like the mass-produced ones! This is also a form of Regression to the Mean — my scores as commentator need to match those of my competitors, if I am to look credible.
These issues have concerned me before, and I have written about them several times:
- Biases in wine quality scores
- Are there biases in community wine-quality scores?
- Are there biases in wine quality scores from semi-professionals?
- Awarding 90 quality points instead of 89
This time around, I am going to tackle the professionals. Doing this is tricky, because it requires a fair bit of closely related data in order to detect biases (maybe >500 scores?). However, the kind people at JamesSuckling.com have taken the risk of giving me complimentary access to their site, for which I do thank them. In return, I have exploited their kindness by taking a look at some of their ongoing series of monthly tasting reports for particular wine regions. *
In order to detect bias, we need to compare our data to some sort of mathematical "expectation". In this case, in an unbiased world, the point scores would show a relatively smooth frequency distribution, rather than having dips and spikes in the frequency at certain score values. Mathematically, the expected scores would come from an "expected frequency distribution", also known as a probability distribution (see Wikipedia). In my earliest post on the subject (Biases in wine quality scores), I used a Weibull distribution (see Wikipedia) as being a suitable probability distribution for wine-score data — this simply models the idea that the tasters assign to each wine the highest score that they believe it deserves, and that there is an upper limit to those scores.
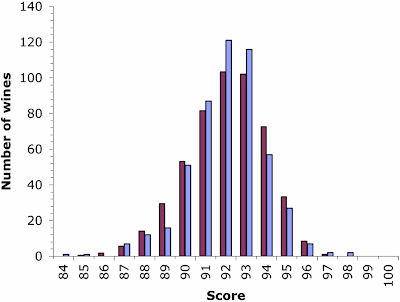
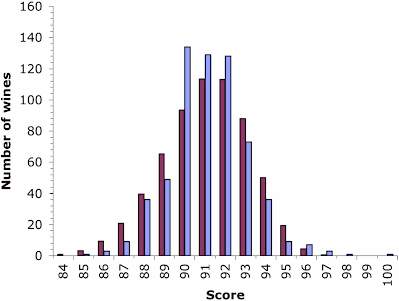
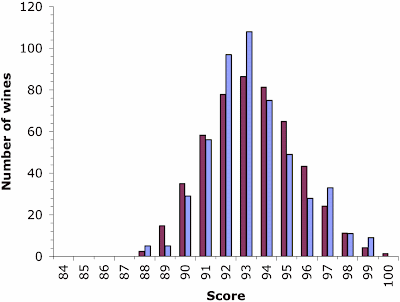
In my analysis here, I have included nine reported datasets, with at least 500 wine-quality scores each: Australia (908 wines), Austria (776 wines), Bordeaux (1,447 wines), California (507 wines), Italy (622 wines), New Zealand (760 wines), Sonoma (505 wines), South Africa (570 wines), and Spain (1,470 wines). The frequency-distribution graphs of the scores from each of these nine datasets are included at the bottom of this post.
So, what are we to make of the results? First, this is nowhere near as bad as many critics have suggested for the wine industry as a whole.
However, the most consistent pattern among the graphs is an over-abundance of scores in the center of the distribution — that is, the purple bars are higher than the red ones for scores of 90—93. This applies to all of the graphs except perhaps the one for Austria. I am tempted to interpret this as an example of Regression to the Mean.
However, note that this bias usually results in a lack of higher scores, rather than a lack of lower scores. That is, the upper scores are generally lower than would be expected for a Weibull distribution. We cannot, under these circumstances, accuse the wine-tasters of the bias of "score creep" towards the upper end of the scale.
An exception to this pattern occurs in the Sonoma dataset, where there is an apparent bias towards a score of 97. For Australia, there is a very distinct lack of scores of 95. Speaking as an Australian, I am tempted to see cultural bias here!
Finally, in five of the nine cases there is an over-abundance of 90 scores compared to 89. I have noted before that this is quite common, and perhaps to be expected (Awarding 90 quality points instead of 89). Interestingly, in two cases this bias is combined with a preference for the alternate even number (88), suggesting a distinct bias against 89.
A wine-quality score is a single number, often produced by a single person, although several different people may be involved in any given report, and different reports are usually produced by different people working for the same publication. In each case, all quality ratings are personal, although they are intended to give the impression of objectivity (see The enduring mythos of wine). However, we do (sort of) hope that there is at least a rank order involved in the order of the ratings; if not, then we have quite a serious level of bias, indeed.
However, that level is not what I have been studying here. Nor have I been studying the oft-cited idea that the score is an adjective modifying a written review of the wine (Where wine ratings and masking meet). In some ways this is an odd point-of-view, because numbers are not used in this way in any other context (tax accounting included).
No, instead I have been looking at the wine scores on their own, and assessing whether they can reasonably be interpreted as a sample from a population of numbers produced by some under-lying process (such as actual wine quality). The scores studied here certainly deviate somewhat from that idea. There is apparently a lot of what mathematicians call Regression to the Mean, where scores are closer to the average than would be expected. This is not, in itself a bad thing, although anyone using the scores needs to be aware that it is happening.
There are persistent accusations of inflationary creep in wine scores, so that the 100-point scale is now effectively a 10-point scale (Don't look up! Inflated scores are attacking the wine industry). There seems to be little evidence of that in the datasets studied here. Obviously, I cannot comment on behind-the-scenes shenanigans, which have also been reported (Are wine scores trustworthy?).
Personal preferences can clearly play a role (Why do we want objectivity in wine criticism?), although I hope that most professionals can deal with that (Confronting bias in wine judging). Perhaps the real problem, though, is that a wine-quality score is one number only, even though it represents a cumulation of different tasting characteristics (for alternatives, see: Are we ready for more complex wine scoring?).
Does any of this matter? Maybe not as much as some commentators would like. For example, when making a decision on which wine to buy, apparently only one-quarter of US wine consumers usually consider a rating (A snapshot of the American wine consumer in 2018). If this is true, then wine critics may well be missing the boat. Wine economists, on the other hand, are safe, because they focus on a different set of wine numbers, eschewing the scores pretty much entirely (There should be a statistical approach to the wine industry).
* You would be wise (not cynical) to wonder about my own bias, if I have been given free access to the very thing I am commenting upon. All I can reply is that, for my own part, I really do value my public reputation as a commentator, not only for this blog, but also for my previous one (The Genealogical World of Phylogenetic Networks), as well as for all of my professional scientific publications.
Frequency histograms for each of the nine datasets
The purple bars show the number of wines (vertically) reported for each wine-quality score (horizontally). The red bars are the expected number of wines, based on the Weibull distribution.
Australia
Austria
Bordeaux
California
Italy
New Zealand
Sonoma
South Africa
Spain


No comments:
Post a Comment