Monday, January 29, 2024

The demise of the (old) wine industry?

Normally, in this blog I investigate and discuss some sort of wine-industry data; but this week’s post is more in the nature of an opinion piece. Please bear with me.

Things like global climate change (the negative effects of which substantially outweigh the positives), biodynamic agriculture, regenerative viticulture, sustainable winemaking, and worldwide over-supply are all undoubtedly big issues in the wine industry, and they rightly occupy a large amount of space in the wine-industry media. However, there is one issue that far exceeds all others — not many people want to drink wine any more. These other issues cannot be addressed properly until the latter one is addressed first; and so I will discuss it here.

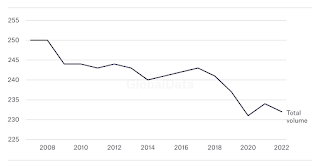
Decling consumption of wine.

The above graph shows recent world wine consumption (mhl) since 2007, as released by the International Organisation of Vine and Wine (OIV). It is not a pretty sight.

There seem to be two issues that combine to create this disaster:
  • declining consumption of alcohol among younger drinkers
  • declining consumption of wine relative to other forms of alcohol, especially cheaper wines.
The first of these issues is obviously important in the long term (eg. it is estimated that 30% of Gen Z drink no alcohol at all), but it is the second issue that I will discuss here.

One of the basic consequences of this issue is, of course, that global wine production always exceeds consumption, as I have written about before:

In response to this ongoing problem with the once-vibrant global wine industry, there have been many comments and suggestions. For example, Rob McMillan (in the Silicon Valley Bank State of the Wine Industry Report) focuses on two solutions:
Industry members either have to “work together to create a resonant message that positively influences consumption”, or “use whatever means we have to increase efficiency in production, grape growing, and marketing”.
However, neither of these is actually a solution, as neither deals with the fact that production > consumption. As Albert Einstein famously noted: “We can't solve problems by using the same kind of thinking we used when we created them.” Using the same thinking, we would respond to over-supply by product discounting and price reductions, and by converting vineyards to other crops. This is short-term thinking, often following the current fashion (eg. Pink won’t save California wine). At worst, it is simply competing against each other, as “we all fish for the same consumers in the same pond” (7 ways to steal market share without lowering your price).

Supply exceeds demand

On the other hand, it seems to me that the fundamental problem is the wine industry itself, not the members of that industry. So, the members cannot resolve the problem, without a fundamental re-thinking of what that industry actually is. The industry has a customer problem — the current industry attitude seems to be: “we make this, and you should buy it”, whereas it needs to be: “you want this, and so we had better provide it”. That is, we must, as they say, change or die.

By this, I mean that so much of the current wine industry, as part of our culture, is exclusionary, rather than embracing. For example:
  1. wine vocabulary is often exclusionary — its taxonomies and labeling confuse people, in its perceived need to “wax poetic” when describing wine sensations (discussed in Different wine talk)
  2. the concept of wine tasting is exclusionary, because people need to be educated in order to appreciate wine, as well as needing to know about grape varieties and wine regions, for example (see Need to know)
  3. we also have follow-on exclusionary practices, such as the Certified Wine Educator credential (see The insider’s guide to the CWE exam)
  4. the price of good wine is often exclusionary, although there is definitely plenty of cheap stuff available (if you like that sort of thing)
  5. also wine tourism is often financially exclusionary — eg. we charge large amounts for winery tastings (they were free in my day, which was the 1970s and 1980s) (see Sharing the dream: Let’s have a day of low-priced tastings)
  6. even the labels are exclusionary, because most jurisdictions do not require an ingredients list on labels, unlike almost all other foods (although this is slowly changing).
This cannot go on. As recently noted by Rodolphe Lameyse (We need to reposition wine in a different way): “I think wine can’t go on being a product that lives by itself.” In particular, we need to explicitly take into account The digital habits of different generations — Gen X’s approach, Millennials’ money, and Gen Z on social media. These people are the customers, and we need to meet them on their terms, not ours.

As recently noted (Wine industry grapples with being something only Boomers like, as younger consumers have ‘mindshare of wine half that of their elders’):
The bigger problem is the wine-drinking consumer. Some 58% of consumers over the age of 65 — essentially, the Baby Boomer generation — prefer wine to other alcoholic beverages. All other demographics are nearly 30 points lower. Even worse for vineyards is that younger consumers aren’t as interested in wine. We must show the will to change and the creativity to evolve and adopt a new approach that retains current customers while appealing to a more diverse population.
 
Branding requires a lot of thinking

In this regard, the single most sensible article about the wine industry that I have read in years appeared recently, from Jessica Broadbent:
I will go so far as to say that “could be” in that title can be changed to “is” — it just seems to be that obvious, to me. I was going to quote parts of the article, but I then realized that I would end up quoting almost all of it; so do yourself a favor and read it all for yourself.

The bottom line with the concept of branding is that a particular product is tailored for, and marketed to, a particular group of people. Provided that the product is manufactured in an acceptable manner (sustainable, biodynamic, etc), then all of the esoteric details referred to above are optional — the customer does not necessarily know them, and does not need to, unless they choose to. Put simply, no-one is excluded in any way, but they are embraced instead. If there are enough customers for the product, then it is sustainable, long-term.

Moreover, as also noted by Rodolphe Lameyse: “Some [vineyards] will no longer make wine but will produce grapes to the specifications set by others who will supply markets under perhaps generic brands.” In other words, the grapes may not only come from one huge generic region (like most bag-in-box wines do), they could come from multiple regions, and perhaps even different regions in different years. It is the brand that is important, not the region or the grape.

So, what grape varieties are involved, and where they come from, is pretty much irrelevant, in the big scheme of things. They could even change from year to year, and still be branded the same way. This idea is horrific to much of the current wine industry, especially in Europe, and also much of the USA; but the way things are going many of them won’t be there much longer, to feel that way. This saddens me, for sure, but a failure to change would sadden me even more. Stop looking in the mirror, and start looking at your (potential) customers, instead.

Einstein on the beach

Einstein on the beach, by Oslo Davis.
Monday, January 22, 2024

Has WHO got it wrong with its new zero-alcohol policy? Probably.

A year ago, the World Health Organization (WHO) changed its attitude towards alcohol consumption, which it said it would recommend reducing as much as possible, because there is “no safe level of alcohol”, and that alcohol is associated with several different types of cancer. I wrote about this change in attitude in my previous post: Who started the current WHO completely negative attitude towards alcohol?. This is a follow-up post, so that previous one could be read as background information.

The important point of that post was that the previous (long-standing) evidence for possible beneficial effects of a small intake of alcohol on human mortality has recently been called into question. The previous evidence had been based on observing a so-called J-curve when plotting human mortality against alcohol intake, as shown in the first figure (below). Naturally, this graph might be right or wrong, and this distinction is the point at issue here.

J-curves of motality versus alcohol intake

Previous advice from WHO (ie. before last January) was based on comprehensive studies like this one (from which the above figure was taken): Di Castelnuovo A., Costanzo S., Bagnardi V., Donati M.B., Iacoviello L. and de Gaetano G. (2006) Alcohol dosing and total mortality in men and women: an updated meta-analysis of 34 prospective studies. Archives of Internal Medicine 166: 2437-2445. This 17-year-old paper concluded:
Low levels of alcohol intake (1-2 drinks per day for women and 2-4 drinks per day for men) are inversely associated with total mortality in both men and women. Our findings, while confirming the hazards of excess drinking, indicate potential windows of alcohol intake that may confer a net beneficial effect of moderate drinking, at least in terms of survival.
More recently, there are also summary papers like this one: Giovanni de Gaetano and Simona Costanzo (2017) Alcohol and health: praise of the J curves. Journal of the American College of Cardiology 70: 923–925. Clearly, this one supports the existence of the J-curves!

However, since then, this J-curve graph has been claimed to not be J-shaped after all, but to be monotonically increasing instead (ie. the more alcohol consumed then the greater the mortality), leading to the conclusion that the safest amount of alcohol is zero intake. That is, the J-curve was previously accepted as being correct, but it is now claimed to be wrong. This conclusion was clearly stated in a report by the Global Burden of Disease (GBD) collaborators; and the WHO has followed them.

My previous blog post called this new conclusion into question. I noted that, while this conclusion is literally true, it is not all of the truth — small amounts of alcohol were shown to be equally as safe as zero alcohol intake. I also claimed that I am appalled by this act of omission (leaving out part of the truth). I will continue my story here, pointing out some limitations of the study mentioned above, along with updated information from a more recent paper.

The GBD collaborators paper

The paper that I have been referring to above, by the Global Burden of Disease collaborators, is:
Alcohol use and burden for 195 countries and territories, 1990—2016: a systematic analysis for the Global Burden of Disease Study 2016. Lancet (2018) 392: 1015–1035.

Since I am questioning it, let’s look at what is in there. Their written summary in two sections of the paper is:

 Methods
Using 694 data sources of individual and population-level alcohol consumption, along with 592 prospective and retrospective studies on the risk of alcohol use, we produced estimates of the prevalence of current drinking, abstention, the distribution of alcohol consumption among current drinkers in standard drinks daily (defined as 10 g of pure ethyl alcohol), and alcohol-attributable deaths and DALYs [disability-adjusted life-years]. For our exposure estimates, we extracted 121,029 data points from 694 sources across all exposure indicators. For our relative risk estimates, we extracted 3,992 relative risk estimates across 592 studies. These relative risk estimates corresponded to a combined study population of 28 million individuals and 649,000 registered cases of respective outcomes.
 Findings
Globally, alcohol use was the seventh leading risk factor for both deaths and DALYs in 2016, accounting for 2.2% (95% uncertainty interval [UI] 1.5—3.0) of age-standardised female deaths and 6.8% (5.8—8.0) of age-standardised male deaths, [so that] the attributable burden for men around three times higher than that for women in 2016. The level of alcohol consumption that minimised harm across health outcomes was zero (95% UI 0·0—0·8) standard drinks per week.
There is no doubt that the contributors have performed an impressive study. They have collated a massive amount of data, and developed some innovative ways to analyze that data, accounting for previous limitations. However, there is still one basic limitation in this type of work — the authors compiled data from pre-existing sources, rather than doing an experiment of their own.

There are ways to grade what is called The Strength of Evidence of any published scientific paper. In this case, Lewis Perdue’s Stealth Syndromes Study grades this type of paper as only Strength C, with this comment:
Published pre-prints may be credible depending upon the study design (clinical, randomized, etc.), the investigators, methods, and institutional affiliations.
Basically, there are these possible Complicating Factors For Human Studies:
    C-SRD: Self reported / selected data
      C-SRDb: Social pressure / desirability approval bias

So, we do not have Grade A evidence, or even Grade B evidence. There are thus serious limitations to the conclusions from the study, and we should bear that in mind when evaluating them. Basically, these are what we call “observational” studies, which do not yield causal data, but merely offer potential connections or indications between observations and conclusions.

Updated data concerning mortality and alcohol intake

Follow-up paper

The paper discussed above is from the Global Burden of Disease (GBD) Study 2016. There has been another part of this series of studies that has been published since then, this time by the GBD 2020 Alcohol Collaborators:
Population-level risks of alcohol consumption by amount, geography, age, sex, and year: a systematic analysis for the Global Burden of Disease Study 2020. Lancet (2022) 400: 185–235

Their notes about their new work are:
For this analysis, we constructed burden-weighted dose–response relative risk curves across 22 health outcomes to estimate the theoretical minimum risk exposure level (TMREL) and non-drinker equivalence (NDE), the consumption level at which the health risk is equivalent to that of a non-drinker, using disease rates from the Global Burden of Diseases, Injuries, and Risk Factors Study (GBD) 2020 for 21 regions, including 204 countries and territories, by 5-year age group, sex, and year for individuals aged 15–95 years and older from 1990 to 2020.
This study thus focuses on variation among ages and countries, which is valuable in-depth information. Their results are:
The burden-weighted relative risk curves for alcohol use varied by region and age. Among individuals aged 15–39 years in 2020, the TMREL varied between 0 (95% uncertainty interval 0–0) and 0·603 (0·400–1·00) standard drinks per day, and the NDE varied between 0·002 (0–0) and 1·75 (0·698–4·30) standard drinks per day. Among individuals aged 40 years and older, the burden-weighted relative risk curve was J-shaped for all regions, with a 2020 TMREL that ranged from 0·114 (0–0·403) to 1·87 (0·500–3·30) standard drinks per day and an NDE that ranged between 0·193 (0–0·900) and 6·94 (3·40–8·30) standard drinks per day.
Note that they refer to the existence of J-curves for some age groups. So, J-curves do exist! Even using roughly the same data as in 2016! Furthermore, note that zero drinks is, indeed, the lower alcohol limit for safety, but that the authors also have a table updating the 2016 results to much less extreme levels. This table is shown as the second figure above.

This sort of apparent conflict among publications is the basic problem with what we call meta-analyses (where the results of multiple studies are considered together). It matters very much which studies are included in the meta-analysis, and what data analyses are done on the results (this is how you end up with Strength C evidence).

Conclusion

So, there you have it. The latest research (2020) is much less extreme in its conclusions about the mortality associated with low alcohol levels than is the previous one (2016). Imagine what might come next! The World Health Organization needs to take note, since it used the first one, but not the second one, even though the latter was published before WHO produced last year's recommendations. There is clearly no longer a consensus about alcohol — there is some sort of controversy, not a clear-cut solution. It seems to be far too early for WHO to make such a definitive (unambiguous) recommendation.

Monday, January 15, 2024

Who started the current WHO completely negative attitude towards alcohol?

I think that I have the answer to the title question, and that answer appalls me. The World Health Organization (WHO) used to accept the idea that small amounts of alcohol were not necessarily bad for you, and may actually have positive effects on some aspects of health. They no longer accept this — now, all amounts of alcohol are considered to be bad. Read on to see why they changed their minds.

I have written about this topic before, but I think that this is a very important one for the wine industry, as this seems to be one of the biggest global threats to that industry (along with local threats from neo-prohibitionists, etc), as also is global warming. This post is actually split into two halves, and will thus be continued next week.

As background, I've written several posts recently about wine and health:

Previously

The reason for the previous positive attitude towards alcohol is summarized by Mark Hicken (Don’t let anti-alcohol grinches ruin your holidays):

The science related to safe levels of [alcohol] consumption has not changed. Hundreds of studies, and decades of scientific research, have consistently shown that those who drink in moderation live about as long (or even slightly longer) than those who don’t drink at all. The reality is that moderate drinking provides some cardiovascular benefits while slightly increasing the risk of certain cancers, some of which are very rare ... For most people, there is little or no effect on overall health and mortality.

The so-called J-curve of mortailty and alcohol

This idea is usually pictured as a so-called J-curve, as shown above. It indicates that small amounts of alcohol (eg. one standard drink per day) actually reduce the risk of people dying (compared to zero alcohol), due to various medical causes. This particular picture is from: Giovanni de Gaetano and Simona Costanzo (2017) Alcohol and health: Praise of the J curves. Journal of the American College of Cardiology 70: 923–925.

Indeed, the Canadian Association for Responsible Drinkers hosts a whole web page covering this topic: Recent Studies on Alcohol + Health. It lists 12 science / medicine studies published from 2018—2023 confirming the health effects of moderate alcohol consumption. It also has links to pages containing both academic and medical commentary on the matter.

In spite of all of this, groups like the World Health Organization (WHO) would now have us believe that there is “no safe level of alcohol consumption and that alcohol causes cancer” (WHO shifts its alcohol narratives). Proactively, the WHO has suggested reducing consumption via global tax increases on “unhealthy products”, including wine (WHO demands tax increases on alcohol and sugar), as I recently discussed (WHO and the use of taxes to reduce alcohol consumption).

What caused WHO to change their tune?

The WHO makes it clear that their change of tune is based on accumulating medical evidence. This leads me to ask an obvious question: what is the first of the recent medical / scientific studies that made these new claims?

My research leads me to identify this published scientific paper, which appears to be a very important one of them, from 2018:

Alcohol use and burden for 195 countries and territories, 1990—2016: a systematic analysis for the Global Burden of Disease Study 2016. Lancet (2018) 392: 1015–1035. (Max G Griswold seems to be the senior author, and Emmanuela Gakidou is the corresponding author.)
This paper is actually a summary of a more detailed report:
Global Burden of Diseases, Injuries and Risk Factors Study 2016. This was authored by the MGBD 2016 Alcohol Collaborators (517 people are listed as the collaborators).

The revised J-curve

The conclusion from the published 2018 paper is:
Alcohol use is a leading risk factor for global disease burden and causes substantial health loss. We found that the risk of all-cause mortality, and of cancers specifically, rises with increasing levels of consumption, and the level of consumption that minimises health loss is zero.
Note that this is literally true, but that it is not all of the truth! Their Figure 5, as shown immediately above, is their revised version of the J-curve (as shown in the top figure). Note that the mortality curve does not drop below zero, which is the point that the authors are emphasizing. However, based on this graph, the authors could equally accurately have said that “the level of consumption that minimises health loss is one drink per day”. This is an act of omission, not commission — what they say is literally true, but it is only half of the story. That is why I am appalled!

An evaluation of the 2018 paper

Anyway, one can see why WHO might change their tack. The report is unambiguous, and actually concludes:

These results suggest that alcohol control policies might need to be revised worldwide, refocusing on efforts to lower overall population-level consumption ... In terms of reducing population-level alcohol use, WHO provides a set of best buys—policies that provide an individual year of healthy life at less than the cost of the average individual income. Governments should consider how these recommendations can be implemented within their local contexts and broader policy platforms, including excise taxes on alcohol, controlling the physical availability of alcohol and the hours of sale, and controlling alcohol advertising.
There is no doubt that the contributors have performed an impressive study. They have collated a massive amount of data, and developed some innovative ways to analyze that data, accounting for previous limitations. However, there is still one basic limitation in this type of work — the authors compiled data from pre-existing sources, rather than doing an experiment of their own. I will discuss this limitation in next week’s post.

Meanwhile, I noted above that previous studies found a positive effect on health of small amounts of alcohol (the so-called J-curve). When discussing these previous J-curves, the authors note:
Past findings subsequently suggested a persistent protective effect for some low or moderate levels of alcohol consumption on all-cause mortality. However, these studies were limited by small sample sizes, inadequate control for confounders, and non-optimal choices of a reference category for calculating relative risks. More recent research, which has used methodologies such as mendelian randomisation, pooling cohort studies, and multivariable adjusted meta-analyses, increasingly shows either a non-significant or no protective effect of drinking on all-cause mortality or cardiovascular outcomes. Our results on the weighted attributable risk are consistent with this body of work.
In estimating the weighted relative risk curve, we found that consuming zero (95% UI 0·0—0·8) standard drinks daily minimised the overall risk of all health loss (figure 5; shown above). The risk rose monotonically with increasing amounts of daily drinking. This weighted relative risk curve took into account the protective effects of alcohol use associated with ischaemic heart disease and diabetes in females. However, these protective effects were offset by the risks associated with cancers, which increased monotonically with consumption.
So, there you have it — the monotonic increase in mortality with increasing alcohol consumption is literally true, based on their data, but it is also true that lower levels of alcohol consumption have no notable difference in effects. The WHO have changed their mind for a very dubious reason. There is more to this topic, which I will cover in my next blog post.

Monday, January 8, 2024

Alcohol control states / countries

I have recently written about the imposition of alcohol excise taxes as a method to control consumption, and thus reduce it per person (WHO and the use of taxes to reduce alcohol consumption). This should work in theory, and apparently also does so in practice. However, there is a more serious way to achieve this same goal — the government can take control of wholesale and / or retail distribution of alcohol (spirits / wine / beer).

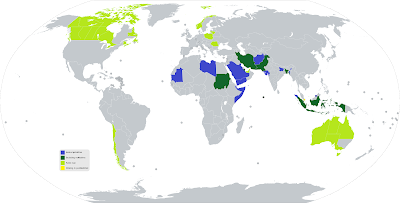
Let’s look at this topic here. Basically, what we are dealing at here is an alcohol monopoly of some sort. In one sense, it is used as an alternative to the total prohibition of alcohol consumption — it reduces consumption but not all the way to zero (as in the countries shown in this map, from Wikipedia).

Countries with an alcohol prohibition

There have been a number of formal studies published in the health literature, looking at a range of countries with different alcohol policies, in order to evaluate the effects of government control of alcohol sales.

For example: Comparative analysis of alcohol control policies in 30 countries.
Donald A Brand, Michaela Saisana, Lisa A Rynn, Fulvia Pennoni, and Albert B Lowenfels. PLoS Medicine 2007 Apr; 4(4): e151. They note:
To assist public health leaders and policymakers, the authors developed a composite indicator — the Alcohol Policy Index — to gauge the strength of a country's alcohol control policies. The Index was applied to the 30 countries that compose the Organization for Economic Cooperation and Development, and regression analysis was used to examine the relationship between policy score and per capita alcohol consumption. The strength of alcohol control policies, as estimated by the Alcohol Policy Index, varied widely among 30 countries located in Europe, Asia, North America, and Australia. The study revealed a clear inverse relationship between policy strength and alcohol consumption.
Similarly, a more ambitious study compared several different Indexes and many more countries: Alcohol control policies and alcohol consumption: an international comparison of 167 countries. Joana Madureira-Lima, Sandro Galea. Journal of Epidemiology and Community Health 2018; 72: 54–60. Their conclusion is:
Index scores and ranks from different methodological approaches are highly correlated (r=0.99). Higher scores were associated with lower consumption across the five methods. For each 1 score increase in the ACPI, the reduction in per capita alcohol consumption varies from −0.024µL (95%µCI (−0.043 to −0.004) to −0.014µL (95%µCI (−0.034 to 0.005).
So, government control of alcohol availability really does seem to achieve its goal of reducing consumption, without actually eliminating it. The World Health Organization does, of course, have an approving report on this topic: Government monopoly on retail sales.

Ranked countries based on the ACPI

According to Wikipedia:
[Alcohol monopolies] exist in all Nordic countries except Denmark proper (only on the Faroe Islands), and in all provinces and territories in Canada except Alberta (which privatized its monopoly in 1993). In the United States, there are some alcoholic beverage control states, where alcohol wholesale is controlled by a state government operation and retail sales are offered by either state or private retailers.
The graph immediately above is from the paper by Madureira-Lima and Galea, listing the Alcohol Control Policy Index (ACPI) for a range of countries. In this case, the bigger the score then the tighter is the government control.

Note that the USA is a long way down the list, although it is not that far behind the United Kingdom, for example. So, there is some sort of serious government control. Wikipedia lists the 17 control or monopoly U.S. states in November 2019 as:
    Alabama
    Idaho
    Iowa
    Maine
    Michigan
    Mississippi
    Montana
    New Hampshire
    North Carolina
    Ohio
    Oregon
    Pennsylvania
    Utah
    Vermont
    Virginia
    West Virginia
    Wyoming
Apparently, about one-quarter of the United States’ population lives in these control states.

The figure above also confirms that the Nordic countries have the greatest government control (ie. Denmark, Finland, Iceland, Norway and Sweden are at the top of the list). The World Health Organization has approvingly discussed their situation: Reducing alcohol consumption, the Nordic way: alcohol monopolies, marketing bans and higher taxation.

For those of you who are interested, I have written several relevant posts about the Nordic situation, notably with regard to Sweden (where I live), and often disagreeing with the view of outside commentators:

I will finish with a recent pertinent web exchange, about the USA:

Tom Wark
My biggest fear is the rise of institutional Neo-prohibitionism. In my view, the threat of government action against alcohol is greater now than it has ever been.
Jeff Siegel:
The solution will require everyone in the wine business — producers, wholesalers, retailers, importers, and the rest — to work together. Which is almost impossible, and may be wine’s biggest problem.

Monday, January 1, 2024

WHO and the use of taxes to reduce alcohol consumption

Greeting of the season:
Gott nytt år! Happy New Year. Bonne année. Frohes Neues Jahr. Feliz año nuevo. Buon Anno!

It has been noted recently that the World Health Organization (WHO) is currently running a campaign to eliminate alcohol consumption throughout the world (WHO shifts its alcohol narratives and the wine industry faces new challenges). As part of this concerted drive, this year the WHO released a Global Report on the Use of Alcohol Taxes. I will look briefly at one aspect of this document here: alcohol taxes.

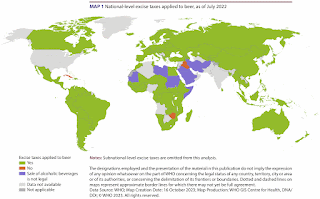
Countries with wine excise taxes

The report notes:
Alcohol consumption is one of the leading risk factors for population health world-wide. While historically predominantly used to raise revenue, excise taxes are an effective tool to decrease the affordability of alcoholic beverages and reduce alcohol consumption and related harms. However, existing taxes on alcoholic beverages differ widely in terms of design and level, and most are not optimized to pursue health goals.
Well, of course they are not! Taxes are principally designed to get money into government coffers, where it can be used for a multitude of things. Improved health may well be one of these things, but taxes are hardly optimized for this use.

Anyway, the report continues:
Amongst the different types of consumption taxes (including excise taxes, value added taxes, or VAT, sales taxes, and import duties), excise taxes are preferred from a public health perspective as they raise the relative price of alcoholic beverages compared to other products and services in the economy, helping reduce affordability.
An excise tax is a legislated tax on specific goods or services at the time they are purchased (Excise tax: what it is and how it works). As such, an alcohol excise tax could be specifically arranged to financially address any ill-effects of alcohol on the community, if the government so decided. It is thus more specific than, say, a sales tax (which might apply to many different products).

Countries with beer excise taxes

However, this is all just theory. As WHO further notes, in practice:
As of July 2022, at least 148 countries have applied excise taxes to alcoholic beverages at the national level. However, wine is exempted from excise taxes in at least 22 countries, particularly those in the European Region. Excise taxes should apply to all alcoholic beverages.
Less than 25% of countries surveyed apply ad valorem excise taxes, with the majority of them (around 60%) applying them on the producer (manufacturer) price rather than on the retail price.
Out of the 148 countries that apply excise taxes to alcoholic beverages covered in this analysis, 21 earmark such revenue for various health programmes, including for universal health coverage, the prevention and control of non-communicable disease (NCD), alcohol control, and the promotion of physical activity.
Countries with spirits excise taxes

WHO further notes:
Volume-based specific excise represents the most prevalent type of excise tax systems applied to beer and wine, while alcohol-content-based specific excise tax systems are the most prevalent for spirits.
The countries involved in these different taxation strategies are shown in the three maps above (taken directly from the WHO report). However, in the case of wine, the WHO need not worry, because Global wine consumption has been declining for a long time, without any changes to the global set of tax systems.