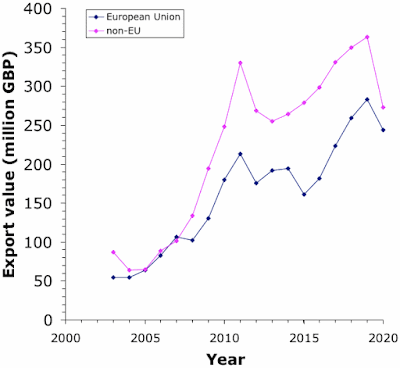
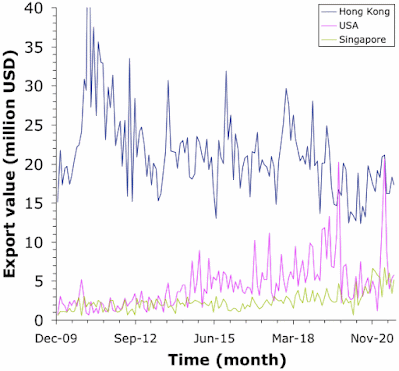
This raises the general question as to how recovery of sales occurs, on those occasions when it does occur. The general scenario I will discuss is this: a growth of sales is interrupted by some adverse event, followed some time later by a return to growth of sales. Well, there are several ways that this return can occur, two of which are illustrated in the graph above.
- For example, the new growth in sales may be exactly the same as before the event, so that, in effect, the main thing the event did was delay things in time.
- Alternatively, the new growth in sales may be faster than it was before, so that the sales make up for lost time, and get back onto the original track (see the above graph). This nullifies the effects of the event, and may be called “full recovery”.
- The third possibility is that the new growth in sales may be slower than before, so that the sales never recover their former impetus, resulting in an ongoing net loss of sales (see the above graph).
The following graph shows the US$ value of the monthly imports into the USA of sparkling wine from France, from January 2002 to November 2021. The data are from the U.S. Bureau of Census (USA Trade Online), via the AAWE. Each point represents one month, while the pink line shows the continuous 11-month average value (ie. centered on each point).
Clearly, there was growth of sales until the U.S. Recession; and during 2008 and the first half of 2009 there was a serious dip in sales. According to Wikipedia, the Great Recession began officially in December 2007 and lasted until June 2009 (Great Recession) — the US stock market crashed during 2008, and US unemployment reached 10% in 2009 (The Great Recession of 2008 explained with dates).
The growth of wine sales then recovered, until the end of 2019, when a second dip occurred. At this time, the US government had decided to apply a 25% tariff on French, Spanish, German and British wine, as part of the Airbus subsidies dispute (How will the new US tariff impact the wine market?). This was then resolved somewhat by a truce (US and France agree tariff truce for a year). This latter dip shows a full recovery of previous sales almost immediately.
However, the first dip is another thing altogether. There is clearly a long and protracted delay in recovery. My question here is a simple one: did sales growth from August 2009 until December 2019 occur at the same rate as it was previously (from January 2002 until December 2008)? The alternative seems to be that the growth rate was faster, indicating a recovery of sorts.
To answer this, I need to define the relevant subsets of my dataset, which are shown in the next graph. The data for the first increase in sales are shown in pink, and for the second growth in blue. The dark points (the dips) are not included in the calculations.
I then ran separate regression analyses of the two subsets of the data, assessing linear growth of sales through time. The resulting equations are listed on the graph, with the top line representing the first growth phase and the bottom line the second growth phase. The two regression slopes are different, with the one for the blue data being higher than for the pink. So, I conclude that there has been recovery of sales impetus, albeit a slow one.
To make this concrete, back in August 2009, the expected forecast of sales would have been US$49.0 million (based on the top regression line), but was in fact US$29.6 million (based on the bottom regression line). This is our estimate of how big was the immediate effect of the Recession on French sparkling wine sales — a hefty reduction of 40%. In contrast, the expected forecast of sales for January 2022 would have been US$89.9 million (based on the top regression line), but was in fact US$75.5 million (based on the bottom regression line) — a reduction of only 16%.
So, it seems that, in this case, “recovery” of sales growth occurred to the tune of 3/5th. The US is not yet “back to where it was” before the Recession, as far as the French are concerned, but it may yet get back the remaining 2/5th, if things continue as they are. How things do proceed depends, of course, on the current pandemic. For example, note that in the graph the sales for October and November 2021 set new record highs (Champagne exports hit record high, bouncing back from Covid slump).


