Monday, June 24, 2019

Does the amount of on-premise wine consumption relate to drink-driving laws?

Alcohol can be purchased and consumed in licensed premises, such as bars and restaurants, or it can be purchased from a bottle shop (liquor store), a supermarket, or online and then consumed elsewhere. It seems obvious that the balance between on-premise and off-premise consumption will vary from country to country. This variation could be caused by various social factors, and in turn it might have quite different consequences.

This variation in consumption is the topic of this post. In particular, what is the relationship with drink-driving laws, which put an upper limit on blood alcohol allowed when driving a motorized vehicle?


The consumption information comes from The International Spirit and Wine Record. The graph below shows the data for those 77 countries where estimated wine consumption exceeded 1 million 9-L cases (a dozen bottles) for the year 2017. The vertical bars show us the estimated number of on-premise wine cases as a percentage of the total number of cases of wine. [Note: only every second country is labeled.]

Amount of on-premise wine consumption by country

Globally, on-premise wine consumption comprises only 26% of the wine market. However, there are two countries where on-premise wine sales is up to 90% (Indonesia and Laos), and 5 countries where sales exceed 70% (add Cuba, Cambodia and India), although most of these places have only small wine consumption in the first place. At the other extreme, there are 3 countries where on-premise sales are estimated at 0% (Iceland, Iraq and Saudi Arabia), also based on small total consumption.

These are the countries where 2017 on-premise sales exceeded 30% of a large wine wine market:
India
Greece
Turkey
Vietnam
Hong Kong
Namibia
Italy
Argentina
Spain
Thailand
Cyprus
Montenegro
Croatia
Austria
Portugal
Japan
Malta
China
Malaysia
Singapore
Kazakhstan
France
Taiwan
Albania
73.6%
63.8%
60.6%
58.1%
54.0%
49.6%
48.2%
45.7%
41.9%
40.3%
38.8%
38.5%
38.5%
37.4%
36.6%
35.1%
34.3%
33.8%
33.0%
31.9%
31.8%
31.4%
31.2%
30.1%

Most of these countries are not known for having a strong wine culture, in which case drinking mainly on licensed premises is to be expected. However, there are also European wine-producing countries like Greece, Italy, Spain, Portugal and France, where wine is a standard part of a meal, especially when going out to eat.

Other wine-loving and wine-producing countries are much lower down the list, including the USA (20.2%), New Zealand (15.4%%), Australia (15.0%), the United Kingdom (14.8%), and Germany (11.2%). I suspect that the heavy price mark-ups associated with licensed premises has a strong influence in these countries, encouraging purchases to be made elsewhere. Indeed, places like Australia have a long tradition of BYO (bring your own) wine at restaurants, precisely to deal with this issue — in this case, the BYO purchase will be recorded as off-premise even though the consumption is actually on-premise.

It is also worth having a look at those countries where almost all wine purchasing and consuming is off-premise. These are the countries where 2017 on-premise sales were below 10% of a large wine wine market:
Finland
Lithuania
Denmark
Slovakia
Russia
Ukraine
Estonia
Switzerland
Belarus
Hungary
Poland
Uruguay
Uzbekistan
Moldova
Norway
Sweden
10.1%
9.9%
9.9%
9.0%
9.0%
8.5%
8.0%
7.8%
7.5%
5.6%
4.5%
3.7%
3.3%
2.8%
1.0%
0.6%

Note that most of these countries are from eastern and northern Europe. Many of them do not have a tradition of drinking wine with restaurant meals — indeed, the idea of being a sommelier in these locations would be rather depressing.

It is possible that drink-driving laws play a role in the amount of on-premise drinking, and this is definitely worth looking into (Bob Henry gave me the original hint). The drink-driving information in the following graph is taken from Wikipedia (Drunk driving law by country), which refers to blood alcohol content by volume (BAC).

On-premise wine consumption and alcohol limits for driving

BAC laws are often different for driving commercial vehicles and also for novice drivers — the data in the graph are the standard ones for each country. Laws also differ between states in the USA — in 2017 Utah became the first state to lower the legal limit to 0.05% BAC, which you can see from the graph is the most commonly chosen limit elsewhere. There are also 7 countries that have no specified limit, although most of these are not big alcohol-drinking countries.

Anyway, there is no obvious general relationship between drinking while out and the allowable limit for driving home again. In particular, note that those countries banning alcohol for drivers still have a wide range of on-premise consumption levels.

However, it is notable that those countries with < 10% on-premise consumption do have laws specifying ≤ 0.05% BAC, and mostly ≤ 0.04%. This is unlikely to be a coincidence. For example, Sweden, the country with 0.06% on-premise drinking has a driving limit of 0.02% BAC, which means that drivers almost never drink, and when they do drink it consists of one low-alcohol beer — wine consumption is for the home!

On the other hand, there are plenty of places with equally strict drink-driving laws that seem to have a lot of on-premise wine purchases. In these locations, I hope that people are catching taxis, or taking some other means of transport than their own car.

Still, in the extreme, strict drink-driving laws do seem to have some effect, in the sense of discouraging wine drinking outside the home.

Monday, June 17, 2019

Mapping an entire continent's vineyards

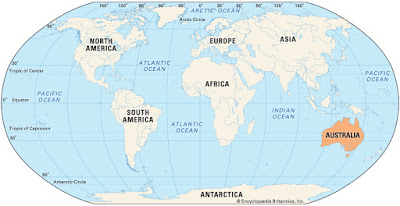
To many people, Australia is a small island somewhere off the coast of South America. It is, indeed, officially an island, the world's largest. However, it also officially a continent, the world's smallest; and it is also a country, with 25 million people.

Because it is a single country, there are things that Australians can do with their continent that no-one else can do with their own homeland. That is, even though it is roughly the same size as the contiguous continental USA, to get something done you only need 25 million people to agree on it, not 325 million — believe me, this is much easier!


If you now re-read this blog post's title, you will see what this has to do with wine. Yes, that's right — during 2018 they decided to use aerial imagery to map every single row of vines on their continent, comprising all 146,128 ha (361,090 acres) of vineyard area, scattered around the 7.7 million sq.km (2.7 million sq.mil) of space available.

This is called the National Vineyard Scan 2018, and is scheduled to be repeated in 2019 and 2020. This is an entirely automatic data-gathering exercise, designed by Consilium Technology, to geolocate all wine-grape vineyards in Australia. The high-resolution satellite images are scanned using an artificial intelligence computer algorithm, which has been trained to detect vineyards automatically. The accuracy of the system is reported to be at least 95%, based on test surveys. [Actually, the system scans only c. 5.1 million ha of the continent, because much of Australia is vineyard-free desert or semi-desert.]

The survey is funded by Wine Australia, the Australian Government statutory authority overseeing the wine industry — this organization is “funded by by grape-growers and winemakers through levies and user-pays charges, and by the Australian Government, which provides matching funding for research, development and extension investments”. This means that the detailed survey results are available only to the levy payers, via the GAIA (Geospace Artificial Intelligence for Agriculture) website.


You can download the full report for 2018 (with some pretty satellite images), or its much shorter summary, from here. In the meantime, above is the official infographic, summarizing the outcome for 2018. This should make wine-industry bodies on the other (multinational) continents green with envy.

Monday, June 10, 2019

The retention time of people on winery mailing lists

Each year the Silicon Valley Bank and Wine Business Monthly collaborate to produce some wine-industry metrics about Direct to Consumer sales in the USA. They do this by sending out a questionnaire to wineries across the land (see Insights for Successful Consumer Wine Sales Survey Questions). The results are compiled into the annual Insights for Successful Consumer Wine Sales publication.

One of the winery questions relates to the retention rate of mailing-list membership:
On average, how many months do wine club / allocated mailing list members stay in your most popular wine club release / mailing list program?
Last week, Wine Industry Insight highlighted the results for the surveys from 2015-2019, arranged by grape-growing region. These data are shown in the graph reproduced here, originally sourced from 2019 Insights for Successful Consumer Wine Sales.

Winery mailing list retention in the USA

There are several things worth noting about these results.

First, the average time for people to stay on a winery mailing list is 29 months, across the 5 regions and 5 surveys. Is 2.5 years a good retention time for mailing-list membership?

The marketing industry has always treated current customers as the “low-hanging fruit”, even suggesting that it costs 5–7 times as much to acquire a new customer as it does to maintain an existing customer relationship (The Wall Street Journal, Nov. 26 2008). The marketers therefore refer to the loss (and replacement) of customers as the “churn rate”.

It is therefore a maxim of successful company growth that retaining the existing customer base is more important than trying to acquire new customers. That is, if the retention rate falls below average then the company cannot be growing. There is the usual 80:20 rule — 80% of your business comes from 20% of your customers — which means that doing something to keep those 20% is more effective than trying to market to new customers.

It is not entirely clear to me that wineries understand these ideas particularly well. If mailing-list people (who are almost always current customers) are being retained for only 2–3 vintages, then this cannot be a Good Thing. How proactive are wineries at increasing their retention rates (or decreasing their churn rates)? It always seems to me that they expend a lot of their efforts on attending wine-tastings of various sorts, which are directed principally at getting new customers (or giving the wine trade free drinks). What are they doing for their current customers, beyond sending an email every now and then?


This is not to say that wineries do nothing, of course. Most wineries offer purchase discounts to their direct customers, for example, and also wines that are not available outside the mailing list. There are even wineries where almost all of their sales come from the mailing list, and there is actually a waiting list for the mailing list; and good luck to them. However, this begs the question of a 2.5-year average retention time. Discounted wine is apparently not enough for most customers to remain interested, at least on its own.

Some wineries also put on special events for existing customers, for example; but this is only effective for those customers who live close enough to attend conveniently. For example, I have always been on mailing-lists where these activities were of no practical relevance to me at all.

This highlights the important point about most of the business coming from the top 20% of the customers. Indeed, it has been suggested that the bottom 20% of the customers can actually be a drain on profit, because it costs more to service them than they bring in as income — the remaining 60% are break-even customers (CFO magazine, January 2009; The Wall Street Journal, June 22 2009). Strategies that target the top 20% (the core customers) are thus the key to financial success — trying to please too many different types of customers can be counter-productive.

This implies spending the effort to identify the top 20%. I am not suggesting that all wineries should conduct what is called a “customer-profitability analysis”, which would result in a “portfolio of needs-based customers”, who will be the profitable ones. However, it would probably pay dividends if the wineries did do it. Their limited resources could then be directed towards servicing and expanding the profitable customer relationships, rather than trying to keep everyone on the mailing list.

This is effectively a Loyalty Program of sorts, which will work only when it somehow enhances the overall value of being associated with the winery, and thereby motivates the loyal buyers to make their next purchase. Sadly, most of my experience with these things (such as frequent-flyer miles) is based on a workplace paying for the service but me getting the loyalty benefits. [Although I did once get free return plane tickets for my daughter and myself, based on the frequency with which we had traveled from Australia to Sweden.]


Other points

The second thing to note about the graph data is that the wineries in Washington state do best at retaining members, while the wineries in British Columbia generally do worst.1 It would be interesting to find out whether the winemakers of Washington are doing something different from their compatriots elsewhere. Or perhaps their wine is, in some way, simply more attractive for Direct to Consumer sales?

The third thing to notice is that there is an apparent increase in retention rates through time.2 In particular, the retention rates for the 2018 and 2019 surveys were 2 months longer than they were for 2015 and 2016. Is this cause for optimism? It would be nice to think so.

Later note: these issues are addressed by Rob McMillan in his comment below.

Conclusion

For me, the bottom line here is that a bit more attention to the current customers (mainly Baby Boomers, I guess) might be more effective than trying to woo new customers (eg. Millenials, etc). This will require careful attention to the causes of mailing-list churn, both throughout the wine industry as well as for individual businesses. The marketing people seem to be missing this simple point — the key to successful marketing is less publicity and more targeted selling. Customer relationships are not one-off events — we need to turn it into a long-term relationship (called the “customer lifetime value”).


1 The data are statistically significant: One-way ANOVA F = 10.59, p = 0.0001.
2 The data for the yearly averages are statistically significant: Correlation = 0.90, p = 0.039. The individual data for both Napa and Sonoma counties are also statistically significant.

Thanks to Bob Henry for directing me to this topic and its discussion.

Monday, June 3, 2019

Is Riesling the world's most under-rated premium grape variety?

I was in a Bengali restaurant (Taste of Bangla) the other evening, and among the beers (Bangla Premium Beer), cocktails (Bangla Sunset, Monsoon Rain) and wines there was a white wine called Last Night a Riesling Saved My Life. I didn't get to taste it, but the name is brilliant. It comes from Rheinhessen (in Germany), and apparently its fruity sweetness goes well with spicy foods.


This contrasts with the word “riesling” from my youth in Australia, where “riesling” was not always a grape but often a wine style, made from any one of a number of grapes. For example, “Hunter River Riesling” was made from Sémillon, and “Clare Riesling” was made from Crouchen.* Fortunately, since Riesling deserves to be treated better than this, the industry started to use the name “Rhine Riesling” when referring to the grape itself (which must have annoyed the people from Alsace and the Mosel), and then later simply “Riesling”.

However, Riesling has long had another image problem, not just in Australia. This is the matter of the style of wine to be expected from any given bottle. Put simply, Riesling has long had an identity crisis — this makes it probably the world’s best “forgotten” grape variety.

Sweet and dry

So, let’s jump right in to the essence of the issue. I will let Rhys Howlett describe the problem:
Riesling is versatile. Around the world its range includes the bone-dry Clare Valley beauties, which take years to lose their vice-like acid grip; austere Oregon offerings; through to some of the most generously proportioned Alsatian examples — rich, mouth-filling, luscious. Riesling can fizz, it can botrytize, it can do just about everything. And another thing it can do very well, or we can do on its behalf, is confuse the drinker.
Given the wide range of potential styles, how is the poor drinker to know what is in the particular wine bottle they have in their hand?

The blatantly obvious solution is to have a bottle label that tells them. The International Riesling Foundation has been trying to promote this idea, using their Riesling Taste Profile, which is a little diagram for use by the label maker, based on a simple linear scale. It describes the style of wine, rather than merely the sugar content, as in this example:


The winemaker provides the word taste description, and the IRF provides the pictorial scale. Note that there are also words to help with understanding the scale, but it is the arrow that contains the actual information. The style information is based on the relationship between the wine's sugar content and its acidity, as indicated in this small table.


For consumers, the focus with Riesling is often on the apparent sweetness of the wine, although fruitiness is often mistaken for sweetness. However, it is the balance between sugar and acid that makes a great Riesling wine. This, of course, means that temperature plays an important part in growing the grapes — the cooler, the better.

Where is Riesling grown?

Given the importance of temperature, we cannot expect Riesling to be grown just anywhere, even within grape-growing regions. Journey Through Wine: an Atlas says of Riesling: “A true mirror of the soil, it expresses terroir brilliantly. In Alsace and Germany, there are surely as many Rieslings as there are villages!”

There are c. 50,000 hectares of Riesling vineyards recorded, as shown in the next table (compiled from here and here).

Riesling acreage

Almost precisely half of the world’s Riesling vineyards are is in western Germany, along the Rhine and Mosel rivers, and in the neighboring part France. (Alsace is good to visit because it looks so perfectly German while culturally being so clearly French.) Here, and here alone, is Riesling the No. 1 grape. The locals treat it with a great deal of respect, even though they cannot usually charge as much for their wines as can many of their brethren elsewhere — this does not say that you can't pay breath-taking prices, if you want to.

The USA is the second largest producer of Riesling, although you will be hard put to find out much about in the wine media. A tad over 50% of the growing area is in Washington, which receives much less media attention than does California (or should I say: the Napa Valley?). The focus in Washington is more on Syrah and Chardonnay, to the obvious detriment of Riesling wines.

Australia is the third largest producer, although the majority of the wine comes from only two regions, as shown in the next graph, from Wine Tasmania (production is indicated by the size of the bubbles). Tasmania is emerging as the highest quality region for all cool-climate grape-growing, and current Riesling grape prices are higher there than elsewhere (as shown by the vertical axis in the graph). However, in keeping with the theme of this post, it is the Tasmanian sparkling wines (made from Chardonnay and Pinot Noir) that garner most of the attention from the wine industry (see Riesling reaches high status in Tasmania).

Riesling yield and price in Australia in 2018

Riesling is also slowly making headway in New Zealand, where it is also expected to do well (see Champion of a ‘misunderstood’ class).

What about climate change?

The sweetness of the wines is a balance between the sugar and alcohol contents of the wine, since sugar creates both alcohol and residual sweetness. There is an obvious concern about a potential relationship between quality (sugar content of the crushed grapes) and quantity (the amount of grapes harvested). The American Association of Wine Economists’ Facebook page looked at this relationship for recent vintages in Germany, without finding any problem:


However, changing temperatures are likely to create more challenges for Riesling growers than for many other grape-growers. Warmer seasons will affect the grapes' balance between sugar and acid, which will make choosing the ideal harvest time more difficult. Making a consistent style from year to year may be impossible. David Schildknecht recently described the effect of the weather on the 2017 Riesling vintage in Germany, for example.

The AAWE Facebook page also looked at this relationship for recent vintages in Germany, and found a strong relationship temperature and grape sugar content. Hotter seasons produce more sugar, as expected:


If you want to drink wines with a lot of residual sugar, such as the Beerenauslese and Trockbeerenauslese styles, then 2018 was a good year for you (2003 was another legendary year).

Grape yields, on the other hand, were much less affected by temperature, as shown next.


Indeed, it is usually reported that yields are most affected by rainfall, both when it occurs and how much there is, so precipitation variation may be a more interesting aspect of climate change to investigate.

Finally, climate change is not only a direct threat to Riesling vineyards but also an indirect one. As pointed out recently, changing weather is also changing pesticide usage, as a means to ameliorate some of the effects; and this is also now an issue in Germany: Riesling wine, holding out between pesticides and climate change.

Conclusion

Riesling vines appear to still be alive, and more-or-less well, in spite of the current dip in consumer focus on the resulting wines. If you want to explore this part of the industry in more detail, then a couple of recent books will help you:
  • Stuart Pigott (2014) Best White Wine on Earth: the Riesling Story.
  • John Winthrop Haeger (2016) Riesling Rediscovered: Bold, Bright, and Dry.


* At the same time, “White Burgundy”, “Red Burgundy”, “Claret”, and “White Hermitage” also referred to Australian styles not French regions, and the wines were rarely made from the grapes usually associated with these wine names. For whites, it is amazing how many different styles you can get just by mixing different proportions of wine from Muscat Gordo Blanco (aka Muscat of Alexandria) and Sultana (aka Thompson Seedless)!