So, let’s start with world wine consumption, as depicted in the report: the OIV State of the World Vine and Wine Sector report for 2022. As you can see (above), consumption has been decreasing (erratically) for the past 15 years. with a steeper decrease for the past 5 years. The media make it clear that it is the younger generations (Millennial and Gen-Z) who are responsible for much of this, by not taking up wine drinking in the same way that their elders did (Why the world has a huge wine glut and why it’s only going to get worse). So, this situation is not likely to change any time soon. Part of this attitude is due to alcohol moderation, of course; and it is not yet really clear how much this is directly affecting the wine industry (Who is winning from the moderation trend?).
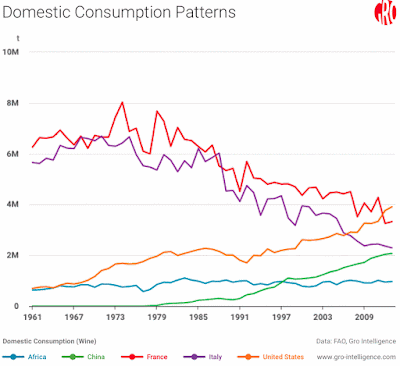
We can now look at the consumption in various individual countries. The above graph covers several well-known wine-consuming (and producing) countries (these FAO data come from: Gro Intelligence). So, France and Italy are going down, China and the USA are going up, and Africa is steady. This means that it is not all gloom and doom.
We can even look at the declining consumption in Sweden, which is also down, for even longer than the global trend. This graph is from my local newspaper, Uppsala Nya Tidning (16 mars 2024). (Oddly, the downward trend started at exactly the time I moved to Sweden, from Australia!)
The reasons for decline are discussed by, for example: Why are so many wine regions dealing with oversupply? Dan Berger also discusses the issue (Growing price sensitivity among consumers):
The decline in wine sales is pervasive, challenged by an increasing array of non-alcoholic beverages and changing consumer behavior. Gone are the days of reasonable wine markup in many retail shops and restaurants, leaving a market now brimming with quality wines that are still overpriced. This shift comes as American wine consumption per capita has dipped to its lowest in two decades, signaling a significant change in consumer preferences.
These data interact with the traditional value-versus-volume distinction (eg. Germany books wine exports value growth but dip in volumes). In this case, the volume of consumption decreases but the consumed wine is of higher value — it is the cheaper stuff that usually decreases, leaving the up-market consumers still drinking.
Furthermore, these graphs refer to the total consumption. We can also look at the per capita consumption (ie. per person), which often shows a different pattern. The above graph is from: Is wine consumption set to decline in the U.S.?, where the overall US increase is matched by the consumption per person. At that link, Tom Wark discusses this pattern in detail.
For comparison (above), are some equivalent data for European countries per person (from: Europe's heaviest drinkers: These are the countries that are drinking more alcohol than before). It shows that overall per-person alcohol consumption in the E.U. has declined by 0.5 liters between 2010 and 2020. However, the individual countries differed a lot, so that consumption fell in 25 countries but increased in 11 countries. In 2020, annual alcohol consumption varied from 1.2 liters in Turkey to 12.1 liters in Latvia.
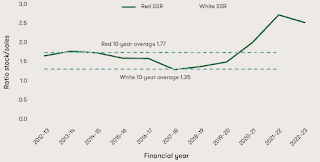
It is also of interest to compare the wine sales to the accumulating wine inventory, which we do above for the U.S.A. (from: Growing price sensitivity among consumers) — both sales and inventory have plateaued recently. In this regard, global consumption patterns can, of course, have a big effect on all wine-exporting countries (eg. Global decline in wine consumption further reduces Australia’s export performance), which consequently increase their inventory when their export sales decrease.
Mind you, America’s love of wines from southern Europe, (France and Italy especially), is a one-sided affair (America’s one-sided love of European wine). According to Eurostat data, the U.S.A. imported more than 5 million hectoliters from France and Italy between August 1 2022 and July 31 2023, while Europe’s five largest wine producers imported little more than 300,000 hectoliters of wine from the U.S.A.
I have also wondered about the data saying that nearly 68 million gallons of foreign bulk wine was imported by California wineries in 2022 (Imported foreign bulk wine: the dirty secret no one in California wine is talking about). How can this be happening when local U.S. production is at risk? After all, 2023 was a dreadful year for wine sales, with a 9% drop in shipments from producers to distributors (The big US wine market roundup). If you want to read up on this, the data at that link are sliced and diced by age group, race and gender.
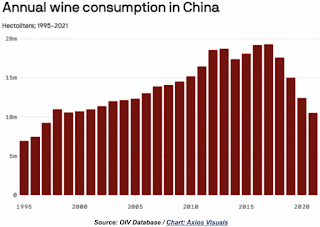
Finally, on a brighter note, it is worth noting that: China bucks the Gen-Z wine trend, with increasing alcohol consumption in that particular generation. Also, IWSR forecasts suggest a continued upward trajectory for India’s beverage alcohol market in 2024 and beyond (Bucking the trend: India’s promise as a beverage alcohol market). Against a backdrop of 1% volume growth for global total beverage alcohol in 2022, spirits volumes in India increased by 12%, with beer up 38%, wine up 19% and RTDs up 40%. Even the U.S.A. has people predicting a “turnaround in the middle of 2024” for wine sales, followed by “a slow recovery in 2025” (Turnaround predicted for wine sales in the US in 2024).
I have produced a few other previous posts on this topic of wine consumption:


